Introduction
In 1937, Swedish biochemist Arne Tiselius demonstrated that charged particles can be separated based on their charge using an electrical field. Biomolecules such as proteins, peptides, nucleic acids, and nucleotides also possess electrical charges and migrate towards either the anode or cathode based on their net charge in an electric field. This process is known as electrophoresis, which involves the migration of electrically charged molecules in response to an electric field.[1]
Tiselius used a liquid medium that had less resolution due to the effect of gravity and diffusion. Electrophoresis uses solid support media with buffers to overcome these obstacles. Molecules with similar charge, mass, shape, and size tend to move together and are separated into distinct bands or zones. Common solid support media include Whatman filter paper, agarose, cellulose acetate, and polyacrylamide.[1]
General Components of an Electrophoresis Apparatus
An electrophoresis apparatus consists of several key components, each with a specific function that separates charged molecules (see Image. Schematic Diagram of an Electrophoresis Apparatus).
- Buffer: Carries the electric current and maintains the pH of the medium.
- Wicks: Connect the support medium with the buffer to complete the circuit.
- Support medium: Serves as the matrix in which the separation of molecules takes place.
- Cover: Reduces evaporation of buffer and prevents contamination during the electrophoretic run.
- Power supply: Provides an electrical field for the movement of charged particles.
- Densitometer: Quantification of separated bands is performed by comparing the optical density of the bands.
Factors Affecting the Electrophoretic Mobility of a Molecule
Size, shape, and net charge of the molecule: Mobility is inversely proportional to the size of the molecule and directly proportional to the net charge of the molecule. Globular proteins have compact structures and faster mobility compared to fibrous proteins of similar molecular weight.[2]
Particles with a negative charge (anions) always move in the direction of the positive pole, whereas particles with a positive charge (cations) always move in the direction of the negative pole. When performing gel electrophoresis, the positive pole refers to the anode, whereas the negative pole refers to the cathode. As a result, charged particles move to the nodes that are appropriate for them. In gel electrophoresis, anions migrate from the cathode (−) to the anode (+).[2]
Strength of the electrical field: Mobility is proportional to the potential gradient (voltage) and inversely proportional to resistance.
Buffer: Buffer functions to carry the current and maintain the pH of the medium. The optimum ionic strength of the buffer is necessary as higher ionic strength increases the share of current carried by buffer ions, slowing down the sample migration and generating heat that leads to increased diffusion of separation bands. The low ionic strength of the buffer also reduces resolution due to reduced overall current passing through the medium.
The ionization of molecules, such as proteins and amino acids, depends on the pH of the medium. Alteration in the pH of the medium can alter the direction and velocity of migration.[2]
Supporting medium: A medium with affinity for sample molecules can impede their migration rate and reduce the resolution of separation. The pore size of the support medium is inversely proportional to the gel concentration; therefore, adjusting pore size according to the properties of the molecule of interest is necessary for optimal resolution.
Fixed groups, such as sulfate, get ionized and acquire a negative charge at alkaline or neutral pH. When an electric field is applied, HO ions associated with these negatively charged groups start migrating toward the cathode. This movement hinders sample movement towards the anode and can reduce separation resolution. This phenomenon is known as electroendosmosis. To minimize its effects, ultrapure agarose gel with low sulfate content can be used.[3]
Types of Support Medium
Different support media and buffers are used to effectively separate various molecules.
Whatman filter paper: Whatman filter paper serves as a support medium. As it requires a long runtime (12-16 h) and low voltage for separation, the resolution is poor due to the increased diffusion of the separated analytes.[4][5]
Cellulose acetate: Cellulose acetate membranes are a preferred solid medium, as they require less runtime (<1 h). As a result, the resolution of separated bands is significantly superior to that of paper electrophoresis. Although expensive, they are widely used for separating lipoproteins, proteins, enzyme isoforms, and hemoglobin variants due to superior resolution and less interaction with analytes in a sample.[5][6]
Agarose gel: Agarose is a type of heteropolysaccharide that forms a viscous solution when dissolved in a hot buffered solution (50-55 °C) but solidifies into a gel upon cooling. This support medium separates serum proteins, hemoglobin, nucleic acids, and polymerase chain reaction (PCR) products. Fixed sulfate groups present in agarose can reduce the resolution of bands due to increased electroendosmosis, which can be prevented using ultrapure agarose gel with low sulfate content.[5][7]
Polyacrylamide gel: Polyacrylamide gel is formed by polymerizing acrylamide and bis-acrylamide in the presence of ammonium persulfate, N, N, N’, N’-tetramethylethylenediamine, and riboflavin under ultraviolet rays. The pore size of the gel can be precisely controlled by adjusting the concentration of monomers. This gel can be used for various analytes, such as proteins, peptides, nucleic acid, and nucleotides, providing excellent resolution due to better molecular sieving and minimal interaction of sample molecules with the matrix.[5][8]
When a protein solution is briefly boiled in sodium dodecyl sulfate (SDS) and mercaptoethanol, the proteins in the solution become denatured and acquire a uniform negative charge, which masks their native charge. This process produces polypeptide chains with a constant charge-to-mass ratio with a uniform shape. In this condition, electrophoretic mobility depends on the number of amino acids and the mass of the polypeptide chains.[5][9]
Other Variants of Electrophoresis
Isoelectric focusing: The gel matrix is filled with ampholytes (positive and negative charge molecules), forming a pH gradient. When the electricity is applied, molecules migrate towards their isoelectric pH. The mobility of sample molecules stops at their respective isoelectric pH, where the net charge on the sample molecule is zero. Isoelectric focusing can provide excellent resolution and fractionation of serum proteins and hemoglobin variants.[5][10]
Immunoelectrophoresis and immunofixation electrophoresis: Initially, proteins are separated on the agarose gel. Wells are created after separation, and specific antibodies against the target molecules are added to them. Bands of precipitation are formed from an antigen-antibody reaction, which signifies the presence of a specific protein in the sample. This method is used to identify the abnormal elevation of gamma-globulin fractions and free light chains in patients with suspected monoclonal or polyclonal gammopathy.[11]
High-voltage electrophoresis: This technique uses a higher voltage range of 400 to 2000 V for separation compared to the standard 250 V, resulting in high-speed separation with good resolution and relatively less diffusion. High-voltage electrophoresis is commonly used to separate proteins, hemoglobin, and nucleotides.[5]
Pulsed-field electrophoresis: Separation of long nucleotide fragments with good resolution is challenging with conventional electrophoresis. In pulsed-field electrophoresis, the current is passed in 2 different directions alternately, which leads to the movement of fragments in 2 directions, resulting in good separation with optimal resolution.[12]
Capillary electrophoresis: A capillary tube with a minimal diameter, filled with a buffer solution, ampholytes, or gel, serves as the support medium. Due to the availability of a higher surface area for heat dissipation, very high voltage can be applied for speedy separation and better resolution. Separated fractions can be quantified simultaneously as they pass through the detector during the electrophoretic run.[13]
Two-dimensional electrophoresis: Isoelectric focusing is performed to separate the analytes based on their isoelectric pH. The gel containing the separated analytes is then subjected to SDS-polyacrylamide gel electrophoresis at a 90° angle to the isoelectric focusing run. Molecules with similar molecular weights can be separated using this method due to differences in their isoelectric pH.[5][10]
Specimen Requirements and Procedure
Register For Free And Read The Full Article
 Search engine and full access to all medical articles
- 10 free questions in your specialty
- Free CME/CE Activities
- Free daily question in your email
- Save favorite articles to your dashboard
- Emails offering discounts
Learn more about a Subscription to StatPearls Point-of-Care
Specimen Requirements and Procedure
Specimen requirements and processing vary depending on the type of electrophoresis and disease involved. Serum, plasma, whole blood, and hemolysate are the most commonly used biological specimens in diagnostic laboratory setups. Nucleic acids or protein extracts from tissue or cellular lysates, as well as products of PCR and sequencing experiments, are the specimens used in research laboratories focused on molecular biology, genomics, and proteomics.[5]
For accurate protein electrophoresis results, proper specimen handling is critical. Repeated freezing and thawing of specimens should be avoided, as this can cause protein degradation, denaturation, or aggregation, which may alter electrophoretic mobility and interfere with interpretation. In specimens with low protein concentration, such as urine and cerebrospinal fluid, protein analysis by electrophoresis requires prior concentration of the sample. Techniques such as ultracentrifugation, dialysis, ultrafiltration, or lyophilization can be used to increase protein yield, thereby enhancing the resolution and sensitivity of protein bands on electrophoresis.
Testing Procedures
Sample details are confirmed using the test requisition form, followed by initial processing in accordance with procedural requirements.
Serum or plasma can be separated from plain or anticoagulant-containing vials using centrifugation. Serum and plasma are used to assess and quantify protein fractions to diagnose disorders related to their synthesis or disposal. Hemolysate can be prepared using buffers and whole blood specimens from the anticoagulant-containing vial. Hemolysate is used to assess and quantify hemoglobin fractions, aiding in the diagnosis of hemoglobinopathies and thalassemia.[14]
Nucleic acid extracts and PCR products can be used after mixing them with sucrose, buffer, and tracking dye. After setting up the instrumentation and gel, the sample is applied, and the electrical supply is started. When tracking dye completes approximately 80% of the run on the gel, the electrical supply is turned off, and the separation of bands is quantified using densitometry.[14][15]
Interfering Factors
The major interfering factors in electrophoresis include heat, nonspecific adsorptive groups on the support medium, and electroendosmosis. As the current and duration of electrophoresis increase, the gel's temperature increases due to heat dissipation. The heat increases the random motion of the molecules in the medium, reducing the sharpness or resolution of the separated bands.
Nonspecific adsorptive groups on the support medium can bind analytes, hindering their mobility across the gel. As described earlier, electroendosmosis generates ion flow opposite to the direction of the analyte motion, leading to a reduction in resolution.[16]
Results, Reporting, and Critical Findings
After the electrophoresis run, the gel is stained for the analyte of interest. After incubation with the staining solution, excess stain is removed by treating the gel with the de-staining solution.
After staining, the gel is visualized using a suitable wavelength of light, and the optical density of each separated band is measured using densitometry. The optical density of each separated band is directly proportional to the concentration of stained analyte present in that band. The report contains the percentage proportion of each stained analyte in the sample.
Table 1. Commonly Used Stains for the Detection of Various Analytes in Electrophoresis
| Analytes | Stains |
| Amino acids | Ninhydrin |
| Proteins | Ponceau S, Coomassie Blue G250, Silver stain, and Amido black |
| Lipoproteins | Sudan Black B and Oil Red O |
| Glycoproteins | Periodic Acid-Schiff stain |
| Hemoglobin | Ponceau S, o-dianisidine, and ferricyanide |
| Nucleic acid | Silver stain and ethidium bromide |
References for the table.[17][18]
An abnormal electrophoretic pattern observed in serum or hemoglobin electrophoresis can prompt clinicians to focus on identifying an abnormal fraction of protein or hemoglobin in the patient's sample. Careful analysis of these patterns can aid in diagnosing underlying disorders that result in the presence of abnormal analytes or the absence of typical analytes in the case scenario.
Clinical Significance
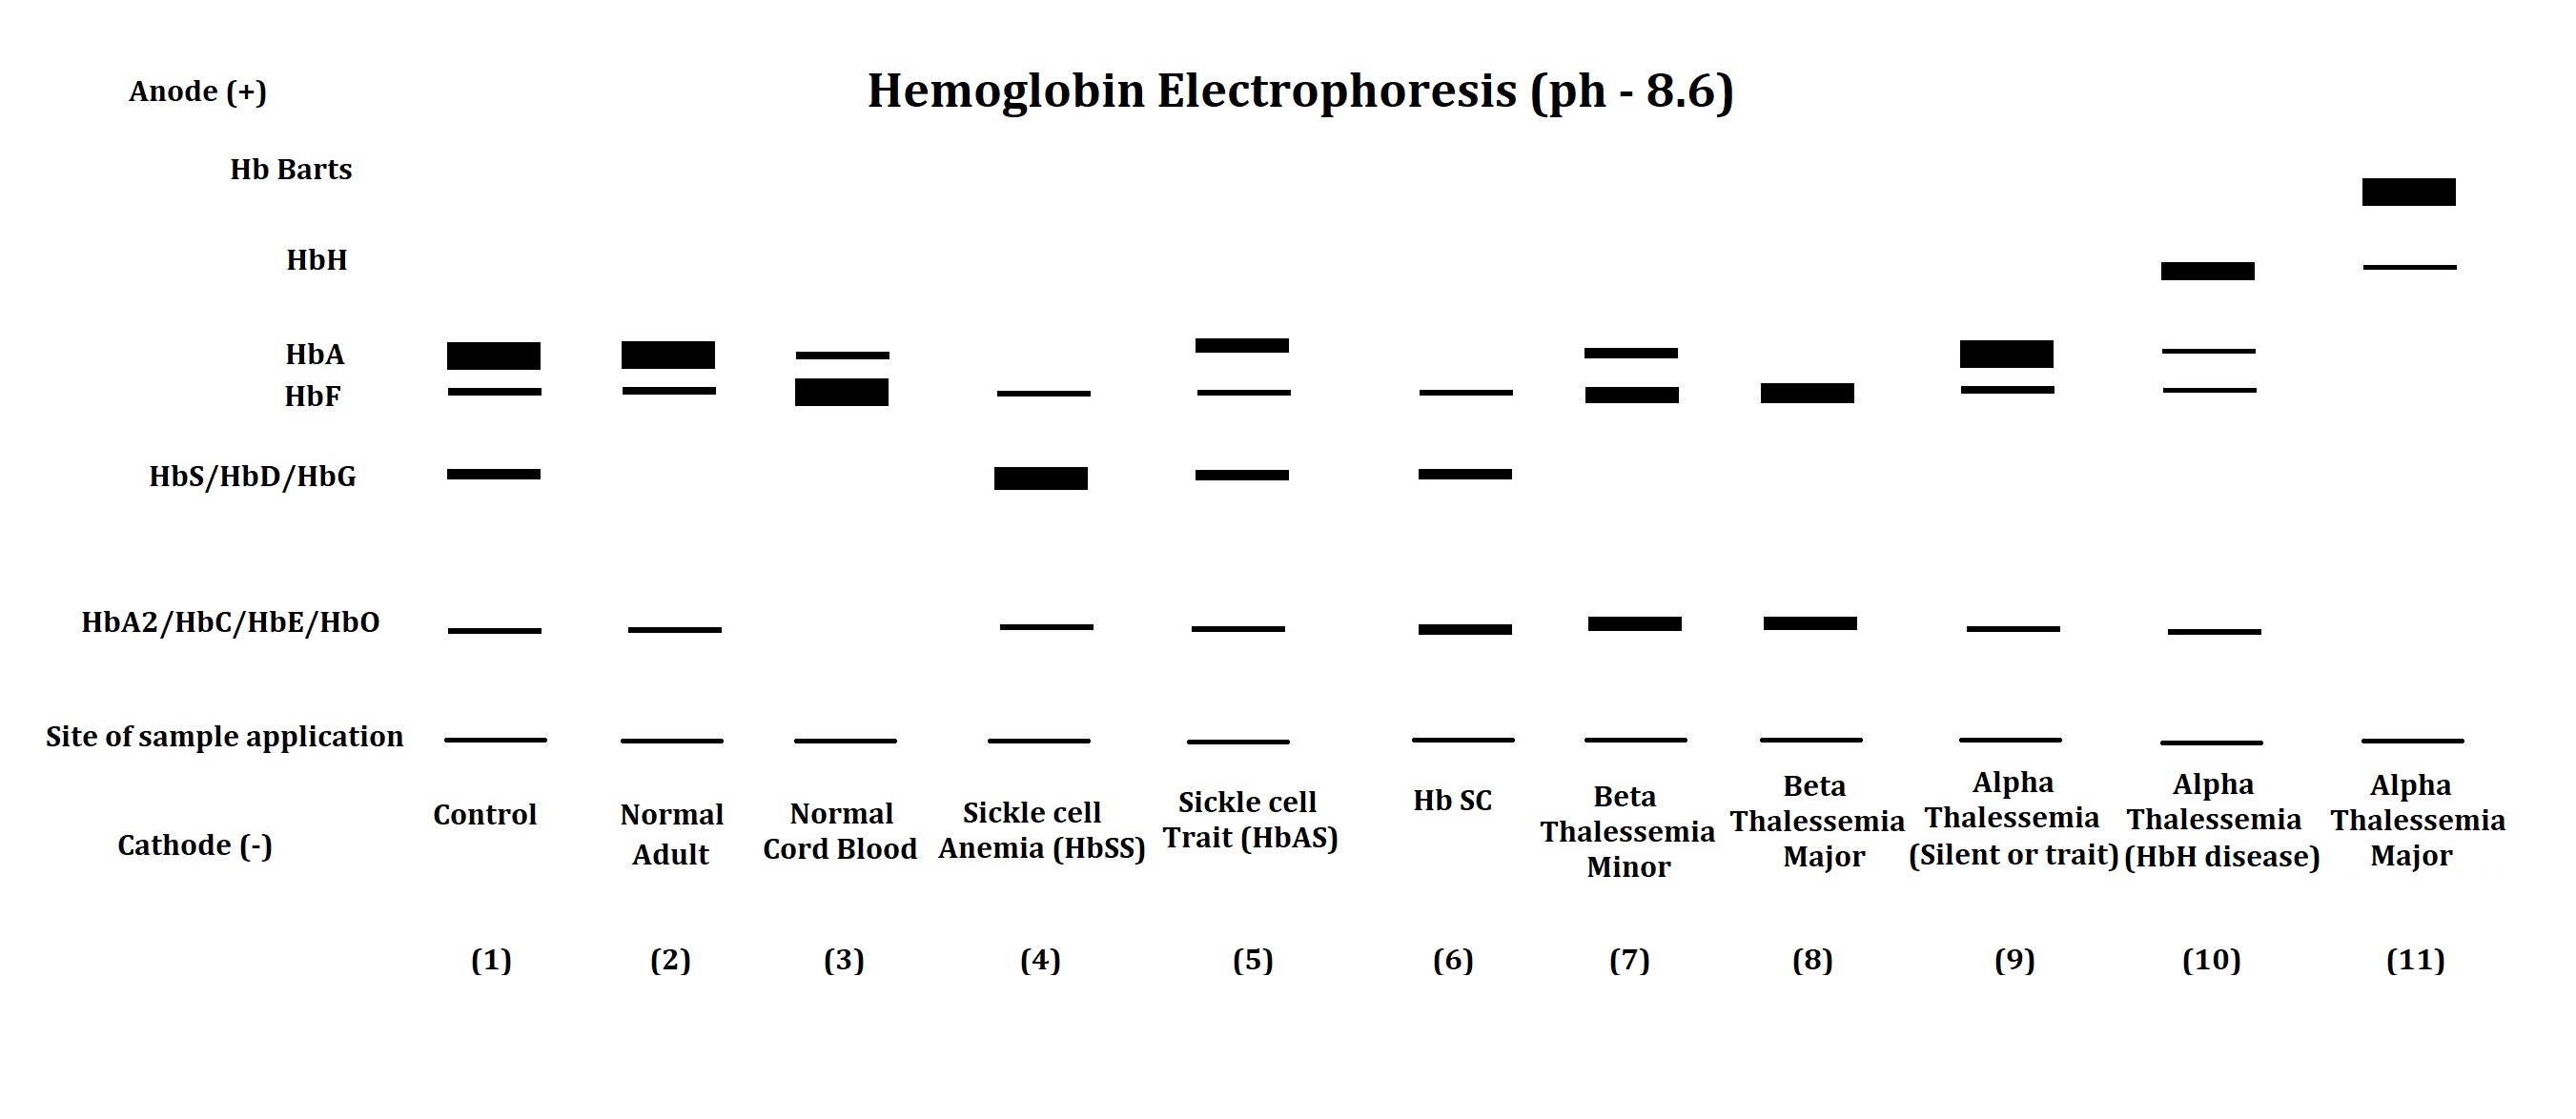
The electrophoresis apparatus shows abnormal hemoglobin electrophoretic patterns in various hemoglobinopathies and thalassemia (see Image. Hemoglobin Electrophoresis Patterns). Comparing abnormal fractions with the control sample helps clinicians narrow down the diagnosis of hemoglobinopathies and thalassemia.
Table 2. Interpretation of Hemoglobin Electrophoretic Patterns
| Lane No. | Observation and Comment |
| 1 | Electrophoretic pattern of artificial control sample: This pattern is used to compare the position of hemoglobin fractions in the patient's sample. |
| 2 | The electrophoretic pattern of a normal adult shows a major fraction of HbA with traces of HbF and HbA2. |
| 3 | The electrophoretic pattern of normal cord blood shows a major fraction of HbF with a trace of HbA. HbA2 may or may not be found in the normal cord blood samples. |
| 4 | In the electrophoretic pattern of a patient with sickle cell disease, both genes of the beta-globin chain carry a mutation. The replacement of glutamic acid with valine at the sixth position of the beta-globin chain results in a reduction in the net charge on the molecule, leading to abnormal hemoglobin, HbS, with reduced mobility compared to HbA. In such cases, HbS is the major hemoglobin fraction, with HbF and HbA2 typically normal or slightly elevated. |
| 5 | The electrophoretic pattern of a patient with sickle cell trait indicates that one of the two beta-globin chain genes has a mutation that results in the formation of HbS. In this case, the presence of HbS and HbA, HbF, and HbA2 is detected. |
| 6 | The electrophoretic pattern of a patient with HbSC disease shows that a mutation in the beta-globin chain results in the formation of HbS in a gene product and HbC in another. The replacement of glutamic acid by lysine at the sixth position of the beta-globin chain leads to the formation of HbC. In such cases, the presence of HbS and HbC is detected along with the presence of HbF and HbA2. HbA is remarkably absent in such patients with HbSC disease. |
| 7 | The electrophoretic pattern of a patient with beta-thalassemia minor shows that a mutation leads to reduced synthesis of the beta-globin chain in one of the beta-globin genes. Elevated HbF and HbA2 fractions, along with the presence of diminished or normal HbA fractions, signify the diagnosis of beta-thalassemia minor. |
| 8 | The electrophoretic pattern of a patient with beta-thalassemia major shows that a mutation leads to reduced synthesis of the beta-globin chain in both beta-globin genes. In such cases, markedly elevated HbF and HbA2 are observed with the absence or minimal HbA. |
| 9 | Patients with silent alpha-thalassemia and alpha-thalassemia minor may not be detected through electrophoresis, as they have a regular electrophoretic pattern. Malfunctioning one or two of the four alpha-globin genes does not impede the synthesis of HbA, as other normal alpha-globin genes can take over the function. |
| 10 | The electrophoretic pattern of a patient with HbH disease shows that three of the four alpha-globin genes are affected. In this case, the decline in HbA levels is found along with the presence of HbH (a tetramer of beta-chain) or Hb Bart's (a tetramer of gamma-chain) with relatively faster mobility than HbA. The decline in HbF and HbA2 levels is also detected in such cases of HbH disease. |
| 11 | The electrophoretic pattern of a patient with alpha-thalassemia major shows that all four alpha-globin genes are malfunctioning. Such cases of alpha-thalassemia major show the absence of HbA, HbF, and HbA2, along with the presence of HbH and Hb Bart's in hemoglobin electrophoresis. |
References for the table.[19][20]
The presence of abnormal bands or attenuation of the normal band in serum protein electrophoresis can provide clinicians with valuable insight into the ongoing disease process.
Table 3. Main Components of Serum Protein Electrophoresis Zones at pH 8.6
| Zones | Components |
| Albumin | Albumin |
| Albumin-alpha-1-interzone | High-density lipoprotein and alpha-fetoprotein |
| Alpha-1 | Alpha-1-antitrypsin, alpha-fetoprotein, alpha-1-glycoprotein, thyroid-binding globulin, and transcortin |
| Alpha-1-alpha-2-interzone | Alpha-1-antichymotrypsin and vitamin D–binding protein |
| Alpha-2 | Ceruloplasmin, alpha-2-macroglobulin, and haptoglobin |
| Alpha-2-beta-interzone | Pre-beta-lipoprotein |
| Beta | Transferrin, complement protein 3, and beta-lipoprotein (sometimes IgA and IgM) |
| Gamma | Mainly IgG, but also IgA, IgM, IgD, and IgE |
Reference for the table.[21]
Table 4. Conditions Associated with Abnormalities in Serum Protein Electrophoretic Patterns
| Proteins | Conditions Causing an Increase | Condition Causing a Decrease |
| Albumin | Hemoconcentration due to dehydration | Burns, nephrotic syndrome, protein-losing enteropathy, impairment of liver functions, chronic infections, malnutrition, and hemodilution during pregnancy |
| Alpha-1-globulins | Pregnancy | Alpha-1-antitrypsin deficiency |
| Alpha-2-globulins | Nephrotic syndrome and corticosteroid therapy | Malnutrition, liver failure, and Wilson's disease |
| Beta-globulins | Iron deficiency anemia, obstructive jaundice, third trimester of pregnancy, and hypercholesterolemia type 2a | Malnutrition |
| Gamma-globulins |
Chronic infections, amyloidosis, lymphoma, leukemia, and collagen vascular diseases Sharp bands in the gamma-globin region can be observed in monoclonal gammopathies, including multiple myeloma, solitary plasmacytoma, heavy-chain disease, and plasma cell leukemia. |
Agammaglobulinemia and hypogammaglobulinemia |
References for the table.[21][22]
The electrophoresis technique can also identify abnormally elevated or decreased enzyme isoforms. Specific enzyme patterns are associated with various clinical conditions, depending on the tissue or organ involved, which aids clinicians in diagnosis and treatment planning.
Table 5. Tissue Origins of Different Isoforms of Clinically Significant Plasma Non-Functional Enzymes
| Enzymes | Isoforms | Tissue of Origin |
| Lactate dehydrogenase (LDH) [23] | LDH 1 | Cardiac muscles |
| LDH 2 | Red blood cells and the brain | |
| LDH 3 | Brain and leukocytes | |
| LDH 4 | Liver and leukocytes | |
| LDH 5 | Skeletal muscles | |
| Alkaline phosphatase (ALP) [24] | Alpha-1 ALP | Epithelial cells of biliary canaliculi |
| Alpha-2 ALP (heat-labile) | Liver | |
| Alpha-2 ALP (heat-stable) | Placenta | |
| Pre-beta-ALP | Bone | |
| Creatine kinase (CK) [25] | CK-BB | Brain |
| CK-MB | Cardiac muscles | |
| CK-MM | Skeletal muscles |
The utility of electrophoresis is not limited to diagnostics. Electrophoresis is widely used for research in genomics and proteomics. Techniques such as restriction fragment length polymorphism, nucleotide sequencing, next-generation sequencing, southern blotting, and western blotting all incorporate electrophoresis as one of their steps. DNA fingerprinting, a technique employed by forensic experts, compares DNA obtained from crime scenes with that of suspects or victims. Additionally, DNA fingerprinting is used to confirm the biological parents of a child in cases of dispute.[26]
Quality Control and Lab Safety
Commercially available control samples are widely used in hemoglobin, serum protein, and nucleic acid electrophoresis to compare the migration of analytes of interest.
Caution must be exercised throughout the electrophoresis procedure, including gel preparation, buffer preparation, apparatus setup, electrophoresis run, staining, and analyte visualization. Monomers used in the preparation of polyacrylamide gels are carcinogenic. If contacted, the catalyst used in polyacrylamide gel preparation can cause skin damage related to free radicals. None of the solutions should be mouth-piped. Barbital buffer containing sodium barbiturate is a known central nervous system depressant. Ethidium bromide, used in nucleic acid staining, is a known carcinogen. Direct exposure of the eye to ultraviolet rays during the visualization of the gel can cause severe damage to the eye.[27]
Enhancing Healthcare Team Outcomes
Diagnosing medical conditions through electrophoresis is most effective when carried out by an interprofessional team that includes specialists such as internal medicine physicians, biochemists, laboratory medicine experts, and laboratory technicians. Each team member contributes unique expertise, ensuring a comprehensive approach to patient assessment. Internal medicine specialists consider the patient's clinical history and presentation, whereas biochemists provide insights into the biochemical mechanisms underlying various conditions. Laboratory technicians play a vital role in accurately preparing samples and conducting electrophoresis assays, which are essential for obtaining reliable results.
Furthermore, correlating clinical findings with electrophoresis patterns allows clinicians to narrow down the differential diagnosis. By integrating the patient's medical history, physical examination results, and additional laboratory investigations, clinicians can identify specific disorders that may present with similar electrophoretic abnormalities. A precise diagnosis enables healthcare providers to develop targeted treatment plans that address the underlying pathology, ultimately enhancing patient outcomes. This collaborative and systematic approach highlights the importance of teamwork in improving diagnostic accuracy and delivering personalized care to patients.
Media
(Click Image to Enlarge)
Hemoglobin Electrophoresis Patterns
Contributed by Amit Sonagra, MD
(Click Image to Enlarge)
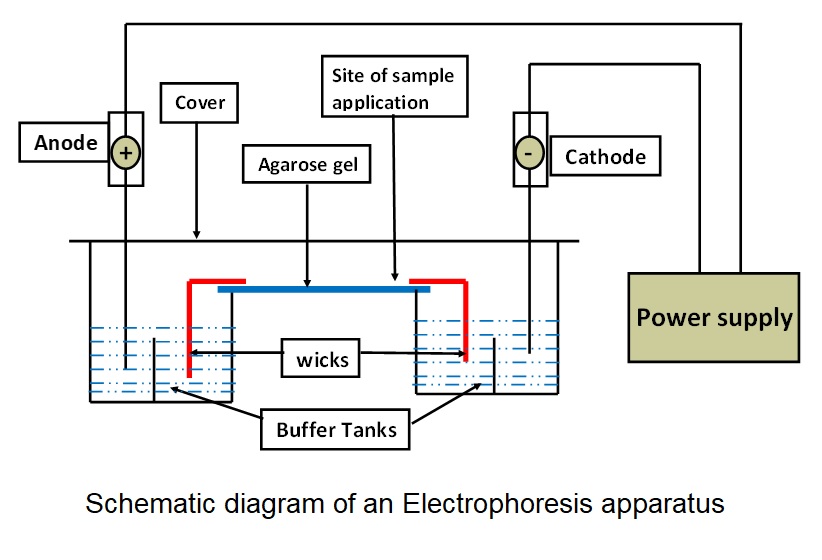
Schematic Diagram of an Electrophoresis Apparatus
Contributed by Amit Sonagra, MD
References
Srinivas PR. Introduction to Protein Electrophoresis. Methods in molecular biology (Clifton, N.J.). 2019:1855():23-29. doi: 10.1007/978-1-4939-8793-1_2. Epub [PubMed PMID: 30426403]
Lee PY, Costumbrado J, Hsu CY, Kim YH. Agarose gel electrophoresis for the separation of DNA fragments. Journal of visualized experiments : JoVE. 2012 Apr 20:(62):. pii: 3923. doi: 10.3791/3923. Epub 2012 Apr 20 [PubMed PMID: 22546956]
Guo Y, Li X, Fang Y. The effects of electroendosmosis in agarose electrophoresis. Electrophoresis. 1998 Jun:19(8-9):1311-3 [PubMed PMID: 9694271]
LARSON DL, RANNEY HM. Filter paper electrophoresis of human hemoglobin. The Journal of clinical investigation. 1953 Nov:32(11):1070-6 [PubMed PMID: 13108968]
Righetti PG. Electrophoresis: the march of pennies, the march of dimes. Journal of chromatography. A. 2005 Jun 24:1079(1-2):24-40 [PubMed PMID: 16038288]
Kumar R, Derbigny WA. Cellulose Acetate Electrophoresis of Hemoglobin. Methods in molecular biology (Clifton, N.J.). 2019:1855():81-85. doi: 10.1007/978-1-4939-8793-1_7. Epub [PubMed PMID: 30426408]
Koontz L. Agarose gel electrophoresis. Methods in enzymology. 2013:529():35-45. doi: 10.1016/B978-0-12-418687-3.00004-5. Epub [PubMed PMID: 24011035]
Green MR, Sambrook J. Polyacrylamide Gel Electrophoresis. Cold Spring Harbor protocols. 2020 Dec 1:2020(12):. doi: 10.1101/pdb.prot100412. Epub 2020 Dec 1 [PubMed PMID: 33262236]
Brunelle JL, Green R. One-dimensional SDS-polyacrylamide gel electrophoresis (1D SDS-PAGE). Methods in enzymology. 2014:541():151-9. doi: 10.1016/B978-0-12-420119-4.00012-4. Epub [PubMed PMID: 24674069]
Friedman DB, Hoving S, Westermeier R. Isoelectric focusing and two-dimensional gel electrophoresis. Methods in enzymology. 2009:463():515-40. doi: 10.1016/S0076-6879(09)63030-5. Epub [PubMed PMID: 19892190]
Level 3 (low-level) evidenceZhu S, Li W, Lin M, Li T. Serum Protein Electrophoresis and Immunofixation Electrophoresis Detection in Multiple Myeloma. Journal of the College of Physicians and Surgeons--Pakistan : JCPSP. 2021 Jul:31(7):864-867. doi: 10.29271/jcpsp.2021.07.864. Epub [PubMed PMID: 34271795]
Feiková S, Klement C. [Pulsed-field gel electrophoresis and its practical use]. Klinicka mikrobiologie a infekcni lekarstvi. 2007 Dec:13(6):236-41 [PubMed PMID: 18320503]
Stolz A, Jooß K, Höcker O, Römer J, Schlecht J, Neusüß C. Recent advances in capillary electrophoresis-mass spectrometry: Instrumentation, methodology and applications. Electrophoresis. 2019 Jan:40(1):79-112. doi: 10.1002/elps.201800331. Epub 2018 Nov 12 [PubMed PMID: 30260009]
Level 3 (low-level) evidenceBLACKWELL RQ, HUANG JT. SIMPLIFIED PREPARATION OF BLOOD HEMOLYSATES FOR HEMOGLOBIN ELECTROPHORESIS. Clinical chemistry. 1965 Jun:11():628-32 [PubMed PMID: 14300079]
. Special Focus on Sample Preparation in Electrophoresis. Electrophoresis. 2021 Feb:42(3):189. doi: 10.1002/elps.202170014. Epub [PubMed PMID: 33523528]
Kurien BT, Scofield RH. Artifacts and Common Errors in Protein Gel Electrophoresis. Methods in molecular biology (Clifton, N.J.). 2019:1855():511-518. doi: 10.1007/978-1-4939-8793-1_45. Epub [PubMed PMID: 30426446]
Sander H, Wallace S, Plouse R, Tiwari S, Gomes AV. Ponceau S waste: Ponceau S staining for total protein normalization. Analytical biochemistry. 2019 Jun 15:575():44-53. doi: 10.1016/j.ab.2019.03.010. Epub 2019 Mar 23 [PubMed PMID: 30914243]
Williams LR. Staining nucleic acids and proteins in electrophoresis gels. Biotechnic & histochemistry : official publication of the Biological Stain Commission. 2001 May:76(3):127-32 [PubMed PMID: 11475315]
Munkongdee T, Chen P, Winichagoon P, Fucharoen S, Paiboonsukwong K. Update in Laboratory Diagnosis of Thalassemia. Frontiers in molecular biosciences. 2020:7():74. doi: 10.3389/fmolb.2020.00074. Epub 2020 May 27 [PubMed PMID: 32671092]
Winichagoon P, Svasti S, Munkongdee T, Chaiya W, Boonmongkol P, Chantrakul N, Fucharoen S. Rapid diagnosis of thalassemias and other hemoglobinopathies by capillary electrophoresis system. Translational research : the journal of laboratory and clinical medicine. 2008 Oct:152(4):178-84. doi: 10.1016/j.trsl.2008.08.004. Epub 2008 Oct 1 [PubMed PMID: 18940720]
O'Connell TX, Horita TJ, Kasravi B. Understanding and interpreting serum protein electrophoresis. American family physician. 2005 Jan 1:71(1):105-12 [PubMed PMID: 15663032]
Level 3 (low-level) evidenceVavricka SR, Burri E, Beglinger C, Degen L, Manz M. Serum protein electrophoresis: an underused but very useful test. Digestion. 2009:79(4):203-10. doi: 10.1159/000212077. Epub 2009 Apr 9 [PubMed PMID: 19365122]
Read JA, Winter VJ, Eszes CM, Sessions RB, Brady RL. Structural basis for altered activity of M- and H-isozyme forms of human lactate dehydrogenase. Proteins. 2001 May 1:43(2):175-85 [PubMed PMID: 11276087]
Wallace BH, Lott JA, Griffiths J, Kirkpatrick RB. Isoforms of alkaline phosphatase determined by isoelectric focusing in patients with chronic liver disorders. European journal of clinical chemistry and clinical biochemistry : journal of the Forum of European Clinical Chemistry Societies. 1996 Sep:34(9):711-20 [PubMed PMID: 8891523]
Swaanenburg JC, Dejongste MJ, Volmer M, Kema IP. Analytical aspects of the automated CKMB1,2 and CKMM1,2,3 isoform determination and its relation to other biochemical markers. Scandinavian journal of clinical and laboratory investigation. 1998 Apr:58(2):167-76 [PubMed PMID: 9587170]
Posch TN, Pütz M, Martin N, Huhn C. Electromigrative separation techniques in forensic science: combining selectivity, sensitivity, and robustness. Analytical and bioanalytical chemistry. 2015 Jan:407(1):23-58. doi: 10.1007/s00216-014-8271-0. Epub 2014 Nov 9 [PubMed PMID: 25381613]
Klein RC. Ultraviolet light hazards from transilluminators. Health physics. 2000 May:78(5 Suppl):S48-50 [PubMed PMID: 10770157]