Introduction
In nuclear medicine, computed tomography (CT) is used with positron emission tomography (PET) and single-photon emission computed tomography (SPECT) machines, which are combinedly called PET-CT and SPECT-CT, respectively. This dual-modality acquires coregistered images of structural and functional details in a single study with datasets complementary to each other and highlights the abnormal functional images with accurate localization of structures. CT imaging, when used in nuclear medicine, helps to improve the quantification of functional images by correcting for attenuation, scatter, and partial volume effects. The images from both modalities are fused using software, and standard uptake values are calculated.[1][2][3]
The concept of combining planar images of 2 modalities dates back to the 1960s, even before the invention of CT machines. However, software for fusion imaging started to develop in the late 1980s.[4] The proper dual-modality fusion approach was pioneered at the beginning of the 1990s by Hasegawa et al at the University of California, who used a diagnostic CT scanner with a SPECT camera to make the first SPECT/CT device. However, the first commercial SPECT-CT was introduced in 1999 by General Electric (The Hawkeye) using a low-power x-ray source with a conventional SPECT camera.[5][6][7]
A similar concept of combining PET with CT was suggested independently in 1991, and the first working prototype PET/CT scanner was developed in 1998, but the first commercial PET-CT was available in 2001.[8][9]
The development of SPECT/CT has improved the sensitivity and the confidence that many nuclear medicine investigations are interpreted.[10] This modality has been useful in diagnosing hyperparathyroidism, thyroid disorders, sentinel node imaging, neuroendocrine imaging, bone disorders, brain imaging, infection imaging, and studies requiring patient-specific dosimetry for dose planning. The combined SPECT/CT is a game-changer in many aspects, initiating a paradigm shift in SPECT utilization into the quantitative realm in nuclear emission tomography.[11]
Similarly, the PET-CT has been a game-changer in managing oncology, cardiology, and neurology patients, along with many others. Head and neck cancers, thyroid cancers, lung cancers, breast cancers, esophageal cancers, colorectal cancers, melanoma, lymphoma, and solitary pulmonary nodules have shown better accuracy when diagnosed with PET-CT. The difference in accuracy between PET/CT and PET alone or CT alone for staging and restaging is statistically substantial and averages nearly 10% to 15% across all malignancies.
Recent advancements within the last 5 years have further solidified the role of PET-CT and SPECT-CT in nuclear medicine, particularly with the integration of novel radiotracers and improved imaging technologies. For instance, a 2021 study highlighted the utility of 18F-FDG PET-CT in pediatric oncology, demonstrating its efficacy in staging and follow-up of lymphomas, brain cancers, and sarcomas while emphasizing strategies to minimize radiation exposure through low-dose CT protocols.[12] Similarly, a 2023 investigation explored the use of SPECT-CT with 99mTc-labeled tracers for radiotherapy planning in lung cancer patients, showing significant reductions in radiation doses to functional lung tissue, thus enhancing treatment precision and patient outcomes.[13] In prostate cancer, a 2020 study validated the superior diagnostic performance of 68Ga-PSMA PET-CT over traditional imaging for detecting metastases, offering improved sensitivity and specificity that guide more tailored therapeutic approaches.[14] Additionally, a 2022 publication underscored the potential of PET-CT in assessing interstitial lung disease in systemic sclerosis patients, leveraging its ability to detect metabolic changes before structural damage becomes evident on CT alone.[15] These recent findings illustrate how PET-CT and SPECT-CT continue to evolve, incorporating advanced radiopharmaceuticals and hybrid imaging techniques to push the boundaries of diagnostic accuracy and personalized medicine across diverse clinical applications.
Function
Register For Free And Read The Full Article
 Search engine and full access to all medical articles
- 10 free questions in your specialty
- Free CME/CE Activities
- Free daily question in your email
- Save favorite articles to your dashboard
- Emails offering discounts
Learn more about a Subscription to StatPearls Point-of-Care
Function
Computed Tomography Physics
CT, or computer-aided tomography (CAT), is a diagnostic imaging modality that uses rotating x-ray tubes, detectors, and computers to generate 3-dimensional images using a linear attenuation map created from the object when x-rays pass through it. Sir Godfrey N. Hounsfield built the first CT scanner in a British research laboratory in 1967.[16]
In September 1971, the first clinical CT machine was installed at Atkinson-Morley Hospital in London.[17] Since then, the technology, capabilities, and clinical applications have changed enormously, especially after introducing multiple-row-detector CT scanners in 1998.[18] Since then, significant advancement has been made in scanner gantry rotation speeds, temporal and spatial resolutions, detector coverage, and overall scan times.[19]
First and second generation scanners
The initial CT scanner developed at EMI Corp (a British electronic firm) had 1 x-ray tube with 1 sodium iodide scintillator detector, referred to as the first-generation CT scanner. The tube and the detector were linearly translated and then rotated with a 1-degree increment to collect 180 views over 180 degrees, unlike current scanners that collect views over 360 degrees. The pencil beam had a 3 mm width and 13 mm length and took around 5 or 6 minutes to complete the scan (see Image. Narrow Beam With Translate-Rotate Motion). To reduce the data acquisition time, the second-generation CT scanners were introduced in late 1974 with the same translation-rotational motion but with a multidetector system that formed multiple narrow beams (see Image. Multiple-Narrow Beam With Translate-Rotate Motion).[20]
In late 1975, with a 30-detector system, the acquisition time was reduced to 20 seconds. However, the heavy x-ray tube and associated electronics were causing frequent misalignments in the hardware due to the fast translational and rotational movements, resulting in severe image artifacts. These drawbacks paved the way for the third generation of CT scanners.
Third generation scanners
The third generation of CT scanners was introduced in late 1975, eliminating translational motion and performing rotational motion only. The x-ray beam was widened as a fan beam to cover the whole patient in the field of view using an array of detectors and took less than 5 seconds to perform the acquisition.[20] The tube and detector assembly were stationary relative to each other while rotating the whole set-up around the patient (see Image. Fan-Beam, Rotate Only).
These models used a power supply to the x-ray tube with electric cables, and the length of the cable restricted the continuous circular motion, which forced the scanner to move clockwise and counterclockwise to acquire adjacent slices. The heavy gantry's continuous acceleration and deceleration limited the scan speed to approximately 2 seconds per rotation. However, this motion caused detector stability issues and image artifacts and led to the investigation of fourth generations of CT scanners. Though third-generation scanners became very popular, today's state-of-the-art scanners only share hardware refinements, eg, slip-ring technology and multiple-detector rows.
Fourth generation scanners
The fourth generation of CT scanners was introduced in 1976, where the detector formed an enclosed stationary ring, and the x-ray tube rotated in a circular motion around the patient inside that ring and achieved a 1-second scan duration (see Image. Fan-Beam With Stationary Circular Detector). However, the tube required a large 170 to 180 cm ring to maintain sufficient tube-patient distance. The full circle detector ring increased the cost of the scanner considerably; however, the spatial resolution could be reached at around 4 mm. Moreover, this generation of scanners could not solve the scatter correction problem.
Electron beam scanners
The electron beam CT scanner (EBCT) was introduced in 1984 for ultrafast cardiac scans, which could be completed in 10 to 20 milliseconds, freezing the heart's motion on imaging. The system had no mechanically moving part and was sealed in a vacuum, similar to cathode-ray tubes. The high-speed electron beam is focused and deflected by carefully built coils to sweep around the target ring. The fan-beam x-rays are produced and collimated to the set of detectors positioned in an arc of 216 degrees. A coverage of 8 cm along the patient axis is obtained for the heart. However, the higher equipment cost and poor image quality for general imaging limit the use of EBCTs.
Slip-ring scanners
Until 1987, cables were used to supply the power to x-ray tubes and communicate detector signals. The rotation was coming to a halt every after 360 degrees, and the cables were looped onto a drum, released throughout the 1 rotation, and then spooled back in the opposite direction. Scanning, braking, and reversal took at least 8 to 10 seconds for each cycle, with only 1 or 2 seconds dedicated to data acquisition. As a result, the temporal resolution was poor, requiring an extended procedural duration. Slip ring technology, introduced in 1987, eliminated interscan delays and permitted continuous nonstop rotation. The slip ring is a circular ring that transfers power and data signals from the stationary part to the rotating part of the scanner (see Image. Slip-Ring Technology).
Spiral scanners
The slip ring technology led to the development of spiral CTs, which became available in 1990; however, its clinical acceptance took another 2 years.[21] In a conventional CT scanner, the collimated x-ray beam is rotated in a circular motion around the object or the patient to measure the attenuation profiles from many angular positions and generate various image planes. The images are reconstructed, and the object is pushed for a small increment within the gantry for the subsequent measurement. This procedure is repeated, and the high-quality images are generated slice by slice. This imaging method, called axial imaging or the "step-and-shoot method, " takes longer. The patient remains still during the scan to avoid blurry images or motion artifacts. A shorter scan duration remained a primary requirement to avoid motion-related artifacts, leading to the invention of spiral CT scanners.
The object continuously moves through the gantry in the Z-direction in spiral CTs. In contrast, the x-ray tube and detector assembly move around the object in a circular rotatory motion in the XY plane to acquire the images continuously (see Image. Spiral CT Machines). A single data set represents the volume covered in a particular number of spiral turns. The spiral CTs are also called helical CTs due to varying names used by manufacturers, not actual differences in modality. The spiral CTs allowed the entire organ to be imaged in a single breath-hold.
A concept of "pitch" is introduced in helical CTs to define the table movement speed and the covered slice thickness. Pitch is defined as "distance traveled by the table" in a single 360-degree gantry rotation divided by "the beam collimation." The pitch has no unit. For example, if the table moves 5 mm in 1 second, the beam collimation is 5 mm, the pitch stands at 1, and the entire x-ray helix is covered with x-ray exposure. Whereas, if the table moves 7.5 mm during a rotation of the x-ray tube and the beam collimation is 5 mm, the pitch would equal 1.5.
Whenever the pitch is >1, a gap in the x-ray helix occurs; however, the entire volume is still covered. This allows a faster scan with a lower radiation burden to the patient but certainly compromises image quality. A balance between image quality and the speed of acquisition should be maintained. In another example, if the table moves 4 mm in 1 rotation and the beam collimation is 5 mm, the pitch would be 0.8. An overlap in x-ray exposure is present, and the exposed area gets more radiation. The pitch values generally vary from 0.7 to 1.5, depending on the imaging study.
Multislice Computed Tomography
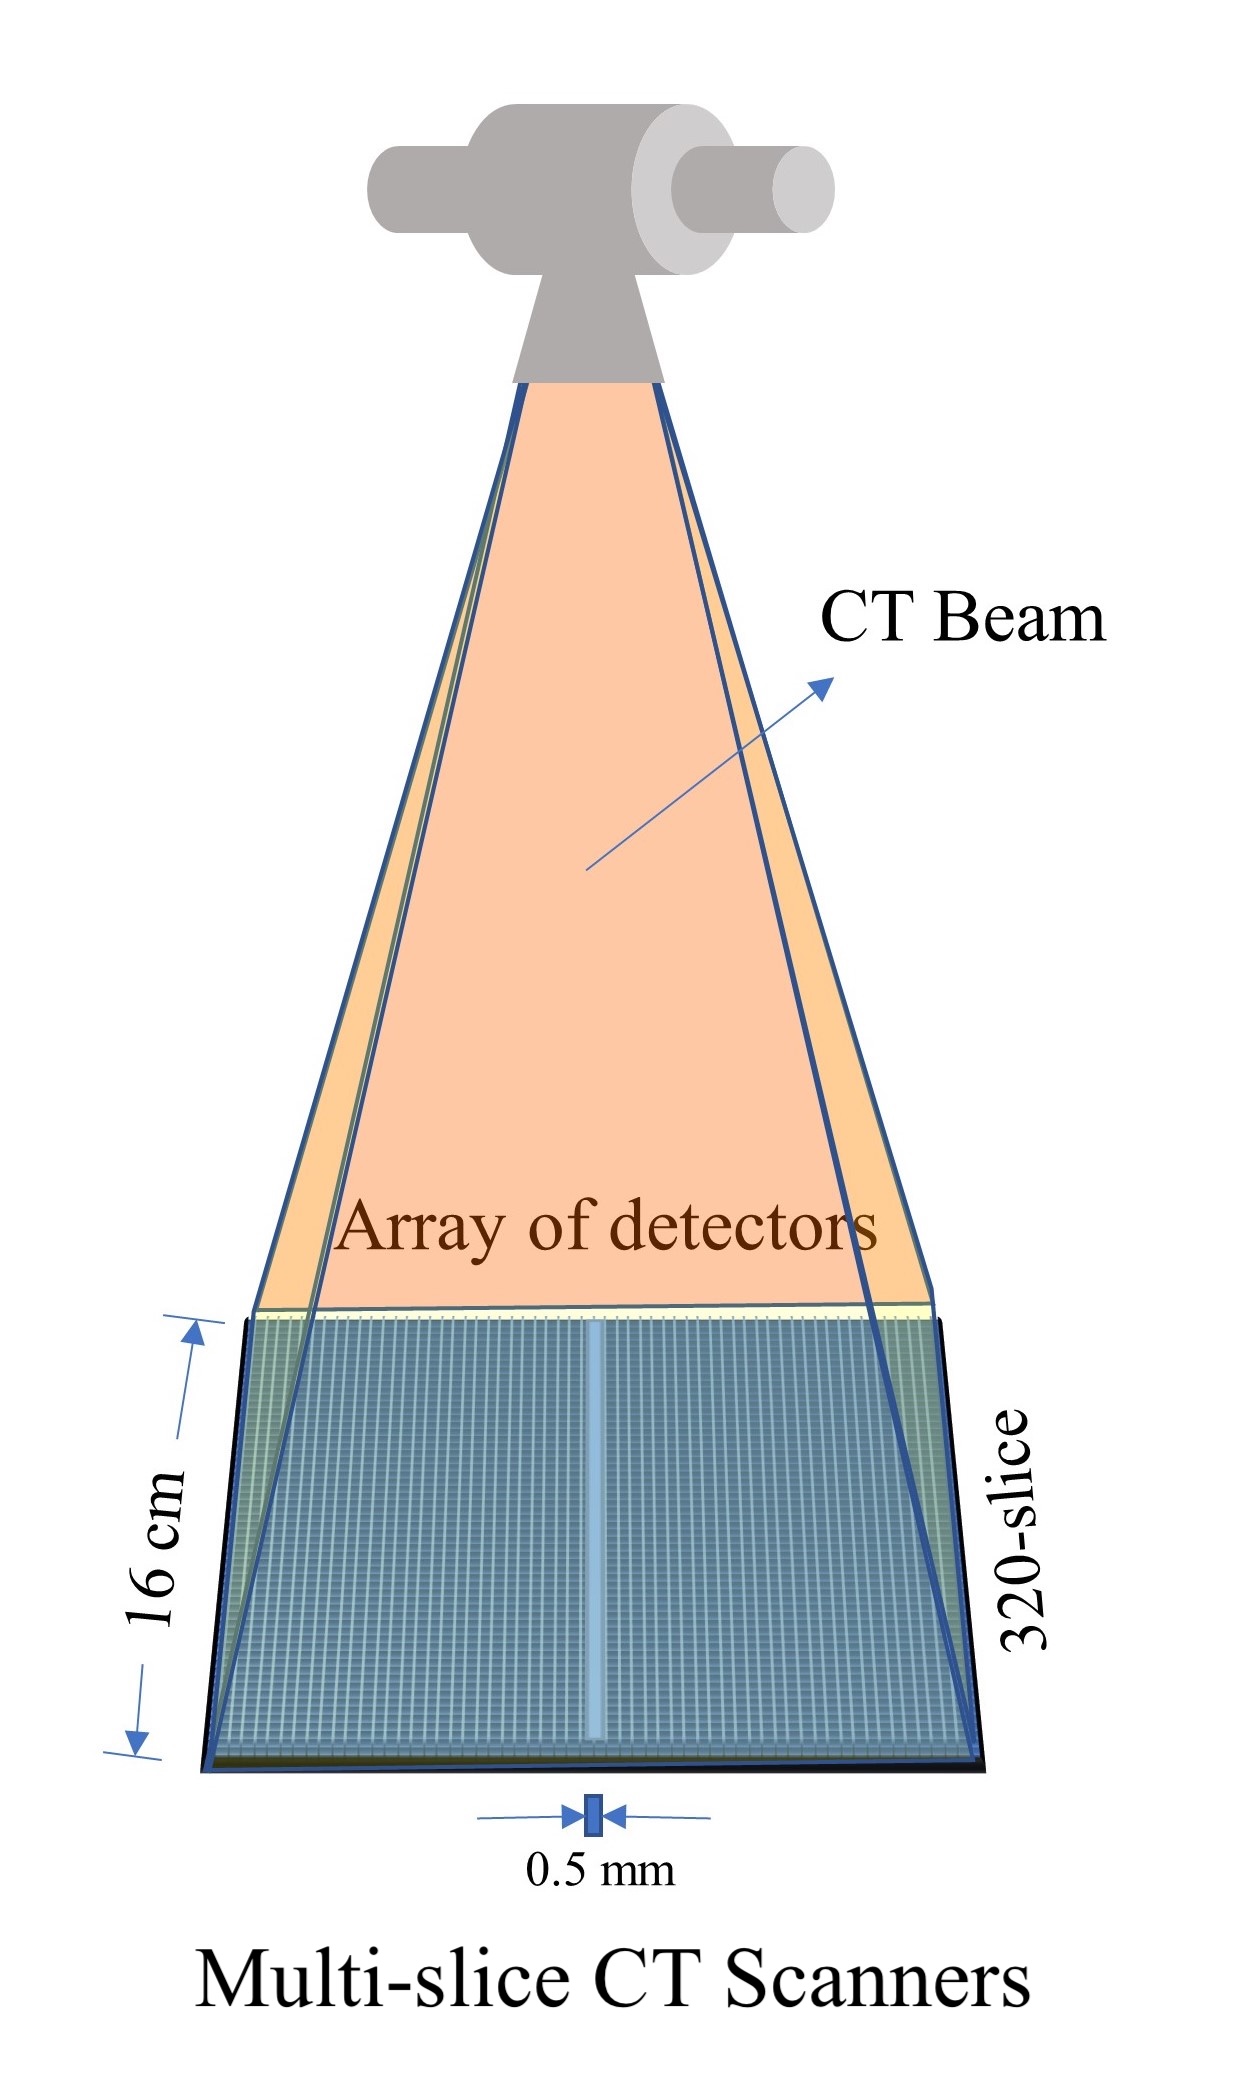
The first modern multislice CTs (MSCT), or "multiple-detector-row CT" (MDCT) scanners, were introduced in late 1998; however, the concept was introduced in 1992 (twin CT).[22] It contains a rotating arc of detectors and the x-ray tubes, allowing volumetric coverage of data acquisition with thin slices. The detectors are placed along the Z-direction in multiple rows (see Image. Multislice CT Scanners). The initial scanners had 16 rows of detector elements with 1.25 mm or 1 mm width along the z-axis and a total coverage of 20 mm. Different vendors used flexible combinations of widths such as 1.25 mm, 2.5 mm (1.25 × 2), 5 mm (1.25 × 4), 10 mm (2.5 × 4), 20 mm (5 × 4) to create 4-slice data channels, as handling of 16-slice data was not feasible at that time. As the capabilities increased, from 2003 to 2004, the manufacturers introduced 6-, 8-, 16-, 32-, and 40-slice models. In 2005, 64-slice models were also introduced with a total z-axis coverage of 32 to 40 mm, depending on the slice thickness of 0.5 mm to 0.625 mm.[22]
Subsequently, from 2007 to 2008, 128-, 256-, 320-slice, and dual-source CT scanners with z-coverage of up to 16 cm were introduced.[23] By 2012, Toshiba medical (now Canon Medical System) introduced a 640-slices CT scanner, which was digitally enhanced from 320-slice to 640-slice with double-slice technology and coneXact™ reconstruction algorithm. However, the z-axis coverage remained the same at 16 cm.[24]
Currently, commonly available CT scanners are 16-, 32-, 40-, 64-, and 128-slice, with less commonly available 256- and 320-slice CT scanners as their cost is significantly higher. Commandeur et al (2019) compared different state-of-the-art models with their technical specifications and showed available tube rotation time of up to 0.270 seconds, temporal resolution of up to 0.135 seconds, and slice thickness of up to 0.5 mm, depending on the model. Many such systems allow simultaneous acquisition of the whole organ, eg, the heart, brain, blood vessels, joints, etc., due to larger Z-coverage. The best reported in-plane spatial voxel dimensions of state-of-the-art MSCTs are 0.23 to 0.4 mm and 0.3 mm in the Z-direction.[19]
X-Ray Production
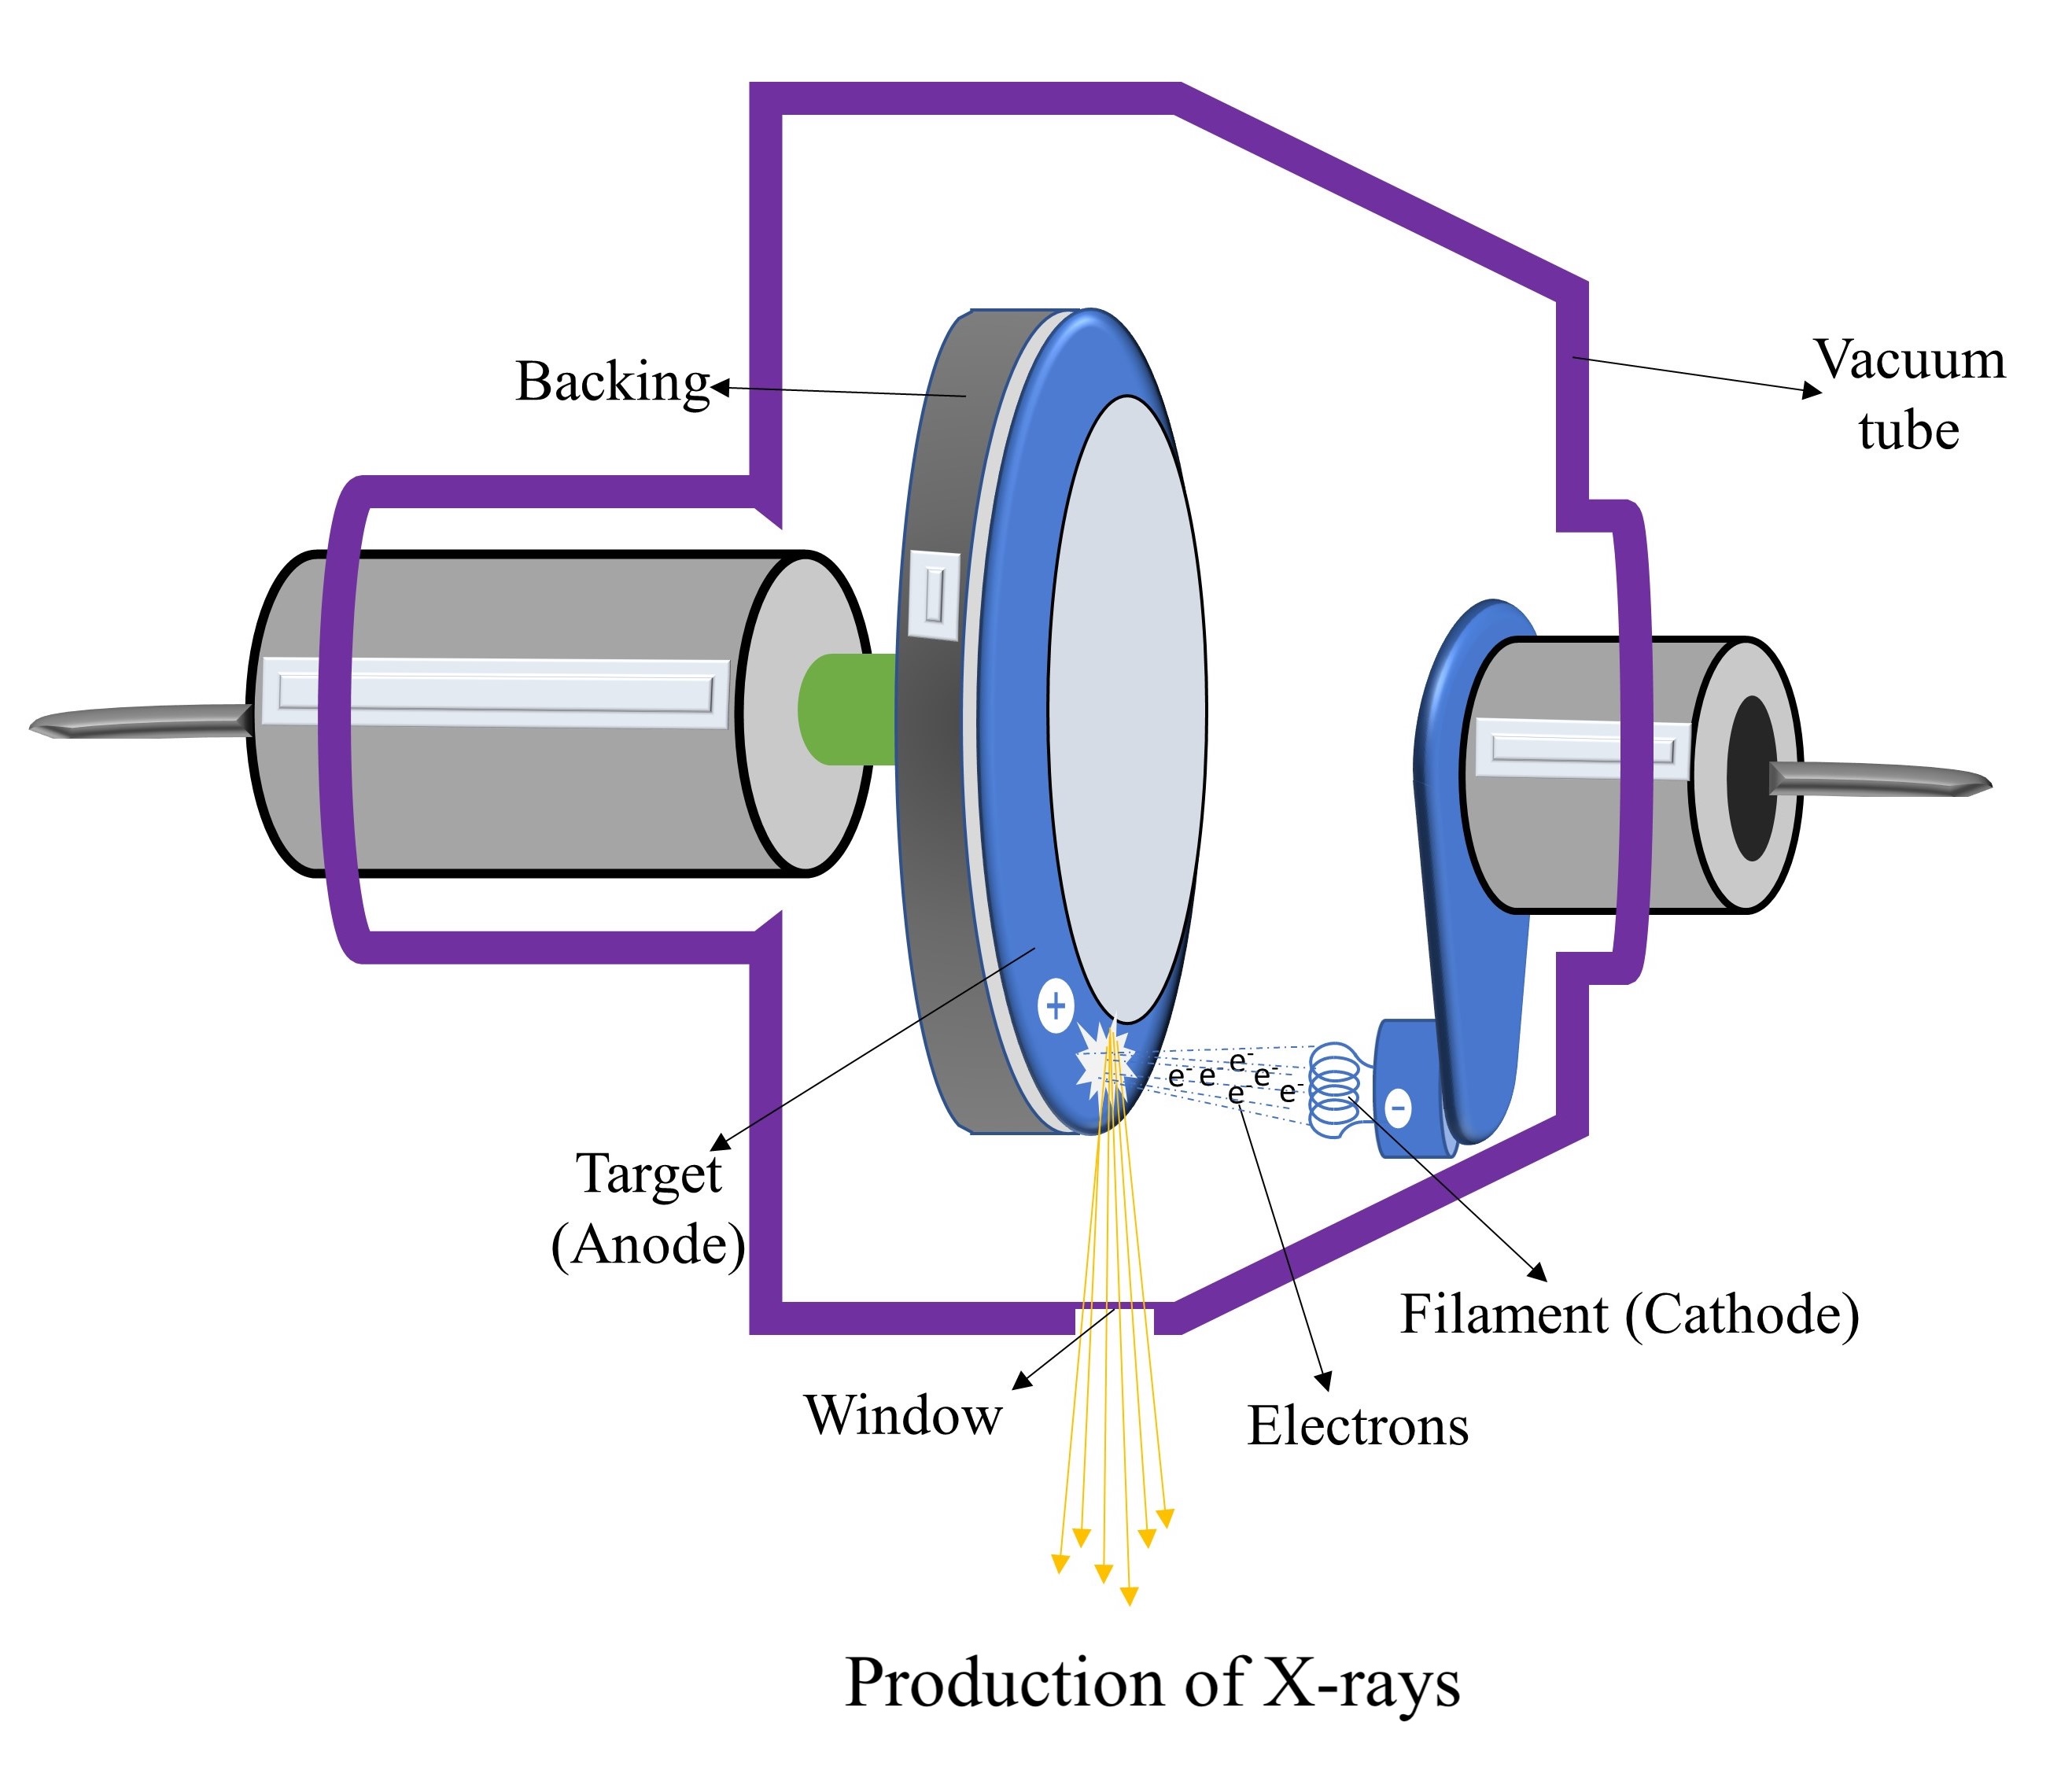
German physicist Wilhelm Conrad Roentgen discovered the first x-ray tube in November 1895.[25] Though the design of x-ray tubes has changed considerably since its inception, the basic principles remain the same. The early x-ray tubes were unreliable and inefficient. In 1913, an American physicist, Dr. William David Coolidge, used the thermionic emission phenomenon to improve the release of electrons from filament using electric current and accelerated towards the anode to produce x-rays. This production method is the prototype for the current generation of x-ray tubes.
The electrons released from the heated cathode are accelerated towards the high voltage anode. This flow of accelerated electrons is called tube current. The electrons interact with the anode, and x-rays are produced in all directions, but they are collimated to emerge from a particular direction and form a beam. The number of electrons liberated from the cathode depends upon the filament's temperature, which is regulated by the electric current to the filament.
Modern x-ray tubes receive 4 to 5 amperes of current to heat the filament. When there is no voltage difference between the anode and cathode, the thermionic emissions remain in the vicinity of the cathode, forming a cloud of electrons. These electrons travel only when a high electrical potential difference in kilovoltage (kV) is present.
Once the potential difference is applied, the electrons rush toward the anode and generate kinetic energy while moving towards the anode. The electron flow from the cathode to the anode forms an electric current of 25 to 1000 milliampere (mA). The cathode is surrounded by a focusing cup, which deflects electrons at a specific location on the anode, called the focal spot. The size of the focal spot is an essential factor and affects the image quality and sharpness of any x-ray imaging system.[26] A smaller focal spot gives better image quality. Routine diagnostic CTs have 2.0 mm of focal spot size.
The tube voltage kV determines the energy of x-rays. The x-rays have energy varying from 0 keV to the maximum or peak applied voltage (kVp). Since x-rays of <20 keV are not useful for imaging and only add to additional radiation burden without any contribution to the image quality, they are stopped using a filter, usually made of aluminum, and placed at a tube window. Also, the amount of electricity (mA) used to heat the coil for a particular duration (seconds) determines the total number of x-rays emitted. The product of these 2 terms is called milliampere-second (mAs).
Tungsten coils have remained the choice of material to act as a cathode in a chemically and physically harsh environment; however, a thin layer of tungsten on a graphite substrate is commonly used as an anode material.[25] Tungsten allows heating temperatures beyond 2000 °C and is a good conductor of heat and electricity. This element has a high atomic number (Z =74). The good conduction of heat allows the anode to remove a large amount of thermal energy generated during electron interactions.
The good electrical conductivity keeps electrons flowing freely and does not allow them to build upon the anode surface to create repulsive conditions for the incoming electron stream. The higher Z materials tend to release electrons easily. Since only 0.2% of thermionic electrons generate characteristic and bremsstrahlung x-rays, a balance of 99.8% of electrons release their kinetic energy in heat, and therefore a considerable amount of heat is generated within the tube; this creates the need for a material having a high melting point (Tungsten has 3370 °C melting point). Gold (Z=79) and molybdenum (Z=42) are other traditional target materials. The anode and cathode assembly are housed within an evacuated glass or ceramic tube (see Image. Production of X-rays). The vacuum within the tube helps prevent the interaction of electrons with any gas molecules.
Computed Tomography Detectors
The x-rays generated from the x-rays tube are read by the detectors opposite it in an arc formation. These detectors are made up of an inorganic transparent ceramic detector and are chosen based on their qualities of good light output, relatively lower afterglow effect, and resistance to the damage created by the radiation over prolonged use. Some of the commonly used materials are cesium iodide thallium activated [CsI (Tl)] crystals, cadmium tungstate (CdWO), gadolinium oxysulfide (GdOS), yttria, and gadolinia with europium activated (Y, Gd)O: Eu or YGdEuO. General Electric (GE) Healthcare has used (YGd)O in many CT scanners, whereas Siemens has used proprietary material such as ultra-fast ceramics (UFC) and Stellar detectors.
Photodiodes convert the scintillation photon generated by the ceramic detectors into electrical signals. These semiconductor devices work similarly to photomultiplier tubes (PMTs) by converting light photons into the current.
Hounsfield Unit
When x-rays pass through the tissues, they are attenuated, and a linear attenuation map is generated from the 360 degrees of rotation of the x-ray tube and detectors. The same is used for reconstructing the image using CT technology. The relationship between transmission intensities for prepatient and postpatient and the linear attenuation coefficient is as follows:
- I = I0 exponential to the power(-ux)
Where I0 and I are prepatient and postpatient photon intensities, x is penetrating path distance along with the patient, and u is linear attenuation coefficient. A reference linear attenuation coefficient of water is set to 1, and a relative number is generated depending on the density of the material in consideration. This relative number is called the CT number or Hounsfield unit (HU) and is calculated with the following formula:
- HU = [(umaterial - uwater)/uwater] × 1000
If we place the linear attenuation coefficient of water as µwater in this equation, the following formula is produced:
- HU = [(uwater - uwater)/uwater] × 1000
Using this equation, the HU of water equals 0.
The attenuation coefficient of a vacuum is 0; since air has relatively minimal attenuation, it is also approximated to 0. Therefore, equation 2 for air is the following:
- HU = [(0-uwater)/uwater] × 1000 = -1000
In most CT systems, the CT numbers vary from −1000 HU to +1000 HU for different tissues. Since the lung is mainly filled with air, its HU value varies between -400 HU to -900 HU, the soft tissues have around -80 HU to 80 HU, and the softer and spongy bones (trabecular bones) have HU values between 100 and 300, whereas harder or cortical bones have a CT number of 300 HU to 1000 HU. The metallic implants have an HU value of around 1000, whereas the HU value for iodinated CT contrast is between 100 HU and 600 HU.
The Physics of Hybrid Imaging
In many clinical conditions, functional imaging modalities (eg, SPECT and PET) provide more information than anatomical imaging modalities (eg, CT and MRI). But these modalities often lack detailed anatomical information. In the 1980s, one of the solutions to this problem was to acquire images separately and merge them using computers. However, these image sets often get misregistered and lead to errors in interpretation.
In the early 1990s, Hasegawa led a group that used a diagnostic CT scanner and conventional gamma camera with a common patient table for sequential imaging of SPECT and CT. The first commercial SPECT-CT was introduced by General Electric (The GE Discovery VG Hawkey) in 1999, and now the SPECT-CT is available with different multidetector CT technology such as 2-, 4-, 6-, 16-, and 64-slice systems.[27]
Similarly, combining PET with CT was also suggested in 1991, but the first working prototype PET/CT scanner was developed in 1998. The first commercial PET-CT was available in 2001 with a single-slice CT system, but now the PET-CTs are available with 128 slices.[28]
Single-Photon Emission Computed Tomography
CT imaging complements the functional information of SPECT in many ways, including anatomical localization of radiopharmaceutical distribution, attenuation and scatter correction, determination of the impact of partial volume effect because of the low spatial resolution of the SPECT system, and conversion of quantitative SPECT images into standardized uptake values. The SPECT is a rotating gamma camera that determines the radiotracer distribution and quantifies the same in 3-dimensional images.
Gamma camera technology has not changed much since its inception by Hall Anger in 1958. In 1963, Kuhl and Edwards demonstrated the first SPECT design, and since then, many configurations have been tried, including rotating patient chairs and translating detectors.[27] However, the SPECT, which used a rotating gamma camera, was introduced in the late 1970s (1977-1980).
The gamma camera, also called an Anger camera or a scintillation camera, consists of the detectors, photomultiplier tubes (PMT), a pulse-height analyzer, an anticoincidence circuit including amplifiers, a positioning circuit, and a computer system. The detector is covered with a collimator and coupled with an array of photomultiplier tubes for positional information. The collimators are made up of lead or tungsten and come in different configurations, including low-energy high resolution, low-energy all-purpose, high energy, and pin-hole collimators for different users' needs.
Only photons moving parallel to the collimator holes reach the crystal and are absorbed. The incident radiation is converted into light photons by scintillator detectors, which are further converted into electrical signals by PMTs to be ready for the subsequent electronics. The commonly used detector configuration is a dual detector system; single or triple detector systems and organ-specific cameras are also available. The gamma camera allows static planar imaging, whole-body scanning with a continuous slow-moving patient table, and the SPECT with detector heads at various angles, eg, 90 degrees, 120 degrees, and 180 degrees.
The spatial resolution of a gamma camera is limited by many factors, including the detector thickness, collimator construction, the patient to collimator distance, the energy of the radioisotope, and the size and density of the organ or the body being imaged. However, the sensitivity is limited mainly by collimators, remaining around 100 to 200 counts/second/Mega Bequerrel (MBq) or 0.01% to 0.02% for gamma-energy of 140 keV. The energy resolution of NaI (Tl) detectors is around 10% in the range of 0.1 to 1.0 MeV photons.
Photon scatter
Approximately 20% to 50% of all detected events by the Anger camera are scattered within the body, and the directional changes allow for mispositioning. This degrades the image quality and increases the background with decreased contrast. This is one of the main reasons scatter correction techniques are required.
Photon attenuation
The gamma photons are attenuated within the body, on the collimators, and within the detector assembly. The attenuation depends on photon energy and the electron density (ie, the Z number of the attenuating material), whereas the attenuation coefficient is the measurement of probability where a unit length of material attenuates the photon.
In CT, the x-ray radiation beam is well collimated to fall on the detector, called narrow-beam collimation. In nuclear medicine, the source is within the body, emitted in all directions, and falls on the detector, which is only a part of total emissions as the detector is in a particular direction. This uncollimated condition is called broad-beam collimation and leads to lower effective attenuation. The conditions of broad-beam and narrow-beam are essential while applying attenuation and scatter corrections in SPECT reconstruction data. They have a significant impact on the reconstructed image.
Corrections for photon attenuation and scattering
The CT number or HU from generated CT data is used for attenuation and scatter corrections in SPECT-CT. Generally, both the corrections are performed in separate steps. The energy of x-ray photons and the photons emitted by the radioisotopes have a different range of energies. The energy of gamma photons used in imaging is higher than that of x-ray photons.
The conversion of the attenuation coefficient from CT number to gamma energy is a bilinear relation but behaves linearly at a threshold value of 0. The bilinear scaling implementation requires preprocessing of CT data and the creation of 2 distinct data sets separated from the threshold value where the relationship changes. This can be easily performed by separating CT numbers at a threshold and applying regression equations to each image set. Then, recombining both data sets finally corrects the data for attenuation.
The scatter correction can also be performed to improve the reconstruction accuracy. The techniques that have been validated for SPECT scatter correction are the "triple-energy-window" (TEW) method, the transmission-dependent scatter correction (TDSC), and the use of the calculations of physics of scattering. The TDSC and the scattering physics calculations both use CT data to improve accuracy.[29][30][31][32]
Positron Emission Tomography-Computed Tomography
PET-CT scanners use positron-emitting radionuclides and are configured in sequential gantries or in-line gantries for PET and CT machines, which share the same patient couch. The Positron-emitting radionuclides, also called PET radionuclides, are neutron-deficient and achieve stability by converting a proton into a neutron (n), a positron (a positive electron), and an electron neutrino. The positron loses its kinetic energy and recombines with one of the orbital electrons in surrounding tissues.
The rest mass-energy of the positron-electron pair (a transient atom called positronium) is converted into 2 photons of 511 keV annihilation, emitted in approximately opposite directions (approximately 180 degrees). This pair of gamma photons is detected by the block of detectors placed in a circular ring. Various scintillation crystals, eg, bismuth germanate (BGO), lutetium oxyorthosilicate (LSO), and gadolinium oxyorthosilicate (GSO) are used as PET detectors.
A coincidence circuit records the valid events within the coincidence timing window. Typically, the coincidence timing window is 6 to 12 nanoseconds. The event detection is stored in a sinogram matrix to represent the activity distribution at a particular angle and axial position. An algorithm reconstructs the sinogram data and represents the activity distribution inside the patient's body. Therefore, the radiopharmaceutical distribution, which follows specific physiological pathways and localizes within the body, can be mapped and measured.
Commonly used positron-emitting radionuclides for medical applications are fluorine-18, gallium-68, oxygen-15, nitrogen-13, carbon-11, and rubidium-82. The energy range of these radioisotopes is 0.634 MeV for F-18 to 3.4 MeV for Rb-82 (see Table. PET Radionuclide Physical Properties.
Table 1: PET Radionuclide Physical Properties [33]
| Radionuclide |
Half-Life (minutes) |
Decay Mode (%) |
Positron Energy (keV) |
Mean Positron Range in Water (mm) |
| F-18 | 109.8 |
Positron (96.9) EC (3.1) |
634 | 0.6 |
| Ga-68 | 67.8 |
Positron (88.9) EC (11.1) |
1.899 | 3.5 |
| C-11 | 20.4 |
Positron (99.8) EC (0.2) |
960 | 1.2 |
| N-13 | 10.0 | Positron (100) | 1199 | 1.8 |
| O-15 | 2.0 |
Positron (99.9) EC (0.1) |
1732 | 3.0 |
| Rb-82 | 1.3 |
Positron (81.8) EC (13.1) |
3378 | 7.1 |
*EC = Electron Capture
Sensitivity
The PET sensitivity is defined as the number of 511 keV photon pairs detected in unit time by the device from each unit of radioactivity present in the source.[34] The sensitivity is measured in counts per second per kilo becquerel or cps/k. The sensitivity increases significantly since PET is a 3-dimensional imaging modality and uses electronic collimation of coincidence detection instead of the absorptive collimators used in SPECT.
The sensitivity also increases by adding more detector material in thickness and axial extent. With a 50% increase in the thickness of LSO crystal (from 2 cm to 3 cm), the intrinsic sensitivity increases by 40%. Increasing axial extent by 30% increases volume sensitivity by 78%. However, increasing axial thickness increases the number of PMTs and thereby the cost of the scanner.
The 5-ring GE discovery IQ Gen2 offers PET axial coverage of 26 cm, whereas the newly introduced Siemens Biograph Vision Quadra offers 106 cm of the axial field of view (3.2 mm crystal element with 51 mm volumetric resolution) and allows total body (vertex to thigh) imaging in one position. However, commonly used PET scanners have 2 to 3 ring detectors, and a typical 3-ring GE Discovery IQ has a sensitivity of 7.78 cps/kBq.
Spatial resolution
The positron physics (ie, emissions and annihilation reactions) limits spatial, temporal, and contrast resolutions. Ideally, starting from the positron range, our equipment should map the origin of positron decay, whereas, in PET imaging, the radiopharmaceutical distribution map is generated for annihilated photons. This sets the lower limit in spatial resolution of the PET camera for any radionuclide used in imaging.
The second limitation is that both annihilation photons are assumed to be collinear; however, they come out at an angle of (180 ± 0.25) degrees. For a typical PET scanner design, the noncolinearity can contribute to about 1.5 mm full width at half maximum (FWHM) for F-18.
Along with these limitations, the PET resolution is further degraded by the PET detectors' material, size, and design. This effect can contribute to about 2 mm resolution degradation. With detector pixel size in the range of 3.2 to 5 mm and 15 to 25 mm in thickness, the PET can provide spatial resolution in the range of 3.5 to 5 mm at the machine level.
Scatter and randoms
If photons of different origins are registered as related events due to scattering from body tissues, these unrelated, erroneously counted events are called scatter events. The number of such events caused by scattering is called the scatter fraction. This is the ratio of scattered events to total events. Random events are those events that are unrelated to each other but are counted as valid events due to the coincidence timing window width.
These events are reduced or eliminated by modeling both processes. Scattered photons can be eliminated by identifying the lost energy in the scattering process and applying simple energy threshold rejection criteria. However, random events can be counted from the singles rate, the coincidence timing window, or by directly counting delayed events acquired out of the timing window. The current detector systems typically lead to 30% to 40% scattering fractions at the system level.[34]
Attenuation and attenuation correction
During interaction with body tissues, the photons lose their energy through Compton scattering or the photoelectric effect, and many of them are eliminated due to significant loss of energy. This loss in the counting of annihilation photons is called attenuation. An algorithm generated from CT transmission data compensates for such losses. However, the mean x-ray energy used in a clinical set-up is approximately 70 keV, far less than the annihilation photons' energy of 511 keV, and must be scaled to such a level.
Since the body has various tissues with different CT numbers, more than one scaling factor is applied to compensate for attenuation corrections. Generally, the CT scan is performed before the PET data acquisition, though the order can be changed, and an attenuation correction map is generated for the entire volume. The attenuation correction factors (ACFs) are formed by reprojecting the scaled CT images and then interpolating from CT to PET spatial resolution. However, severe mismatches can be generated for many reasons, including patient respiration, oral and intravenous contrast, and metallic implants.
Issues of Concern
Breathing Artifacts
The involuntary breathing motions cause the majority of PET or SPECT and CT misregistration issues. The CT acquisition can acquire the images in a single breath-hold and fix the position of organs, eg, the lung, liver, spleen, diaphragm, and heart, which move during respiration. But, PET or SPECT imaging (combinedly called emission scans) takes longer, and respiratory blurrings are bound to occur. This causes a misalignment of both images, particularly near the diaphragm area.
The same is also manifested in the attenuation correction factor map generated by the CT images. Many methods, including altering breath-holding patterns, mid-inspiration, or end-expiration during CT acquisition, have been tried to solve this problem. However, the best solution is simply acquiring the CT data without any instruction other than allowing the patient to take shallow breaths while directing them to lie still besides involuntary motions.[35]
Contrast Agent Artifacts
CT imaging with intravenous and oral contrast can help with anatomic localization. However, since the contrast is denser in attenuation, it can falsely alter the attenuation map generated by the CT data and inaccurately represent gamma photon attenuation in certain areas. This can result in artifacts in the final images.
Many solutions to this problem have been considered, including viewing nonattenuation-corrected images and correlating them with attenuation-corrected images. However, this can be cumbersome for many software applications. Another solution is to acquire low-dose noncontrast CT and use it for attenuation correction. However, both solutions have their own merits and demerits. A software-based solution has been tried to generate an attenuation correction algorithm that does not generate artifacts, which is the most appealing solution to these artifacts.[36]
Orthopaedic Metallic Implants and Chemo Port
The orthopedic metallic implants and in-situ chemo ports cause photopenic areas in PET and SPECT images. When using CT data for attenuation correction, the concerned area is overestimated, and artifacts in the final image are observed. Though correlating such areas of the artifact is easy, when clinically relevant lesions are adjacent to such artifacts, interpretation becomes difficult, especially in cases of infection or loosening.[37]
Dental implants or fillings can also cause such artifacts and obscure real lesions or create apparent lesions in a patient with head and neck malignancies involving the oral cavity or tonsils.[38][39] Some other areas of concern that affect the image quality are patient size, positioning of arms, and calcified lymph nodes.[36]
Clinical Significance
Applications of Single-Photon Emission Computed Tomography
Applications of SPECT-CT imaging include:
- The SPECT-CT provides 10% better quantification accuracy than planar imaging, allowing its use for individualized radionuclide treatment planning. Such implementations improve patient outcomes.
- SPECT-CT improves the sensitivity and specificity in the preoperative localization of parathyroid adenomas and improves the detection rate in the asymptomatic group.[40] It also improves image contrast and quantification, enabling the precise localization of intra-thoracic goiters.
- In thyroid cancer management, accurate staging and risk stratification are essential. SPECT-CT allows more precise characterization of the etiology, ie, benign versus malignant.
- SPECT-CT has significantly improved the diagnostic accuracy of neuroendocrine tumors. Also, this helps in optimizing peptide-receptor radionuclide therapy with patient-specific dosimetry.
- In the case of skeletal scintigraphy, the SPECT-CT again increases the specificity and positive predictive value in oncology patients. It also better defines the extent of metastases by reducing unnecessary diagnostic procedures.
- In orthopedic implants with suspected infection, the SPECT-CT has provided accurate information, which allows differentiation of bone infection from soft tissue infection. It is also beneficial in diagnosing relapsed osteomyelitis with posttraumatic structural bone alterations.[41][42]
- The SPECT-CT detects coronary artery stenosis and myocardial perfusion abnormalities in coronary artery disease. In a selected group of patients, it improves the diagnostic accuracy of detecting CAD and guidance regarding revascularization procedures. Also, the anatomical information provides advantages of coronary artery calcium scoring along with perfusion data.[43]
- The SPECT-CT provides many additional values in sentinel node imaging for breast cancer, melanoma, oral cavity, penile, vulvar, prostatic, testicular, renal cell, cervical, endometrial, and lung malignancies.
- In the case of lung ventilation-perfusion (VQ) scintigraphy, the authors, in a study, found that the SPECT alone and SPECT-CT have a sensitivity of 97%, whereas the specificity of SPECT increased from 88% to 100% in the case of SPECT-CT.[44]
Applications of Positron Emission Tomography-Computed Tomography
Undoubtedly, PET-CT has changed the management of oncological patients. A seemingly limitless variety of PET tracers has covered all cancer hallmarks.[45] 18F-FDG (fluorodeoxyglucose) is the established radiotracer for oncological applications; however, novel tracers such as 68Ga-FAPI (fibroblast-activation-protein) alone have shown its uptake in 28 kinds of cancers.[46] The enhanced knowledge of cancer characteristics allows the detection of different metabolic or pathogenic pathways within cancer cells, resulting in the development of new radiopharmaceuticals.
Apart from oncological applications, the PET-CT is beneficial for non-oncological applications such as in the assessment of myocardial viability, cognitive impairment or Alzheimer’s disease, infectious and inflammatory diseases, evaluation of sarcoidosis, the diagnosis of osteomyelitis, spondylodiscitis of non-postoperative origin, the investigation of pyrexia of unknown origin (PUO), postoperative fever, recurrent sepsis, septic embolisms, detection of synovitis in the shoulder, hip, and sternoclavicular joints, assessment of the atheromatous plaque calcification along with many more.[47]
In the past 5 years, PET-CT applications have continued to evolve with cutting-edge research. A 2022 study validated the use of 18F-FDG PET-CT in detecting early immunotherapy response in non-small cell lung cancer, showing its ability to predict treatment outcomes within weeks, thus enabling timely therapeutic adjustments.[48] Furthermore, a 2020 publication explored the utility of 18F-DOPA PET-CT in diagnosing and managing pheochromocytomas and paragangliomas, reporting a sensitivity of 98% and specificity of 95%, significantly outperforming conventional imaging.[49] In nononcological contexts, a 2023 study demonstrated the effectiveness of 18F-FDG PET-CT in identifying infection sources in patients with implanted cardiac devices, reducing diagnostic delays, and improving surgical planning.[50] These recent developments highlight PET-CT’s expanding scope, driven by novel tracers and refined imaging protocols, reinforcing its indispensable role in both oncological and non-oncological precision medicine.
Other Issues
Patient safety is paramount in high-quality healthcare and is defined as reducing the risk of unnecessary harm associated with healthcare to a minimum acceptable.[51] A study published in 2020 by Kasalak et al included 147 patient safety incidents reported in nuclear medicine practice from the period between 2014 to 2019 and concluded the majority of patient safety incidents in nuclear medicine occur in 3 primary International Classification for Patient Safety (ICPS) categories. These areas are medication, clinical administration, and clinical process or procedure.[52] [Level 2] They are key strategic areas for incident prevention and patient safety improvement.
The incidents that can be commonly reported in nuclear medicine include:
- Extravasation of radiopharmaceutical or CT contrast agent despite checking with a saline flush causes pain and a swollen arm. A rescheduling of the study can be an option.
- Incomplete patient verification by the radiopharmaceutical administration staff, resulting in a medical event as per the United States National Regulatory Commission Regulations (USNRC) 10 Code of Federal Regulation (CFR) Part 35.3045
- Wrong administration of radiopharmaceuticals such as I instead of I-mIBG
- Administration of CT contrast media despite reportedly informing history of an allergic reaction
Proper interprofessional communication within the department, attentiveness towards the assigned job, and knowledge of the key areas of medical errors can be the key to avoiding such incidents. Knowing the science and the professional skills is a basic need of any profession. Several studies suggest that medical errors could have been prevented under better conditions and communications, improving outcomes and enhancing team performance.[53][54]
Enhancing Healthcare Team Outcomes
In the field of nuclear medicine, delivering safe and effective patient-centered care requires a highly coordinated, interprofessional approach grounded in a strong understanding of nuclear medicine physics. Physicians, advanced practitioners, nurses, pharmacists, technologists, and physicists must work synergistically to ensure accurate diagnostics, effective treatments, and minimized radiation exposure risks. Each team member plays a vital role: physicians determine the appropriate radiopharmaceutical and imaging protocol; physicists oversee radiation dosimetry and ensure imaging systems function optimally; technologists acquire high-quality image data; radio-pharmacists ensure the safety and efficacy of radiopharmaceuticals; and nurses manage patient preparation and monitoring. Together, these responsibilities require clear communication and precise execution to avoid potentially harmful errors that may compromise patient safety or image quality.
Strategic interprofessional communication and well-defined responsibilities are crucial for successful coordination between nuclear medicine and referring departments, eg, cardiology, oncology, or pediatrics. The timely and accurate exchange of clinical information ensures that the most appropriate nuclear medicine procedures are selected and carried out safely. Team performance is further enhanced through regular training, cross-disciplinary collaboration, and adherence to radiation safety protocols. A shared understanding of nuclear medicine physics across roles empowers healthcare professionals to anticipate and address procedural complications, maintain compliance with safety standards, and collectively optimize patient outcomes. This collaborative, knowledge-based strategy not only supports effective clinical decision-making but also reinforces a culture of safety and excellence in nuclear medicine practice.
Media
(Click Image to Enlarge)
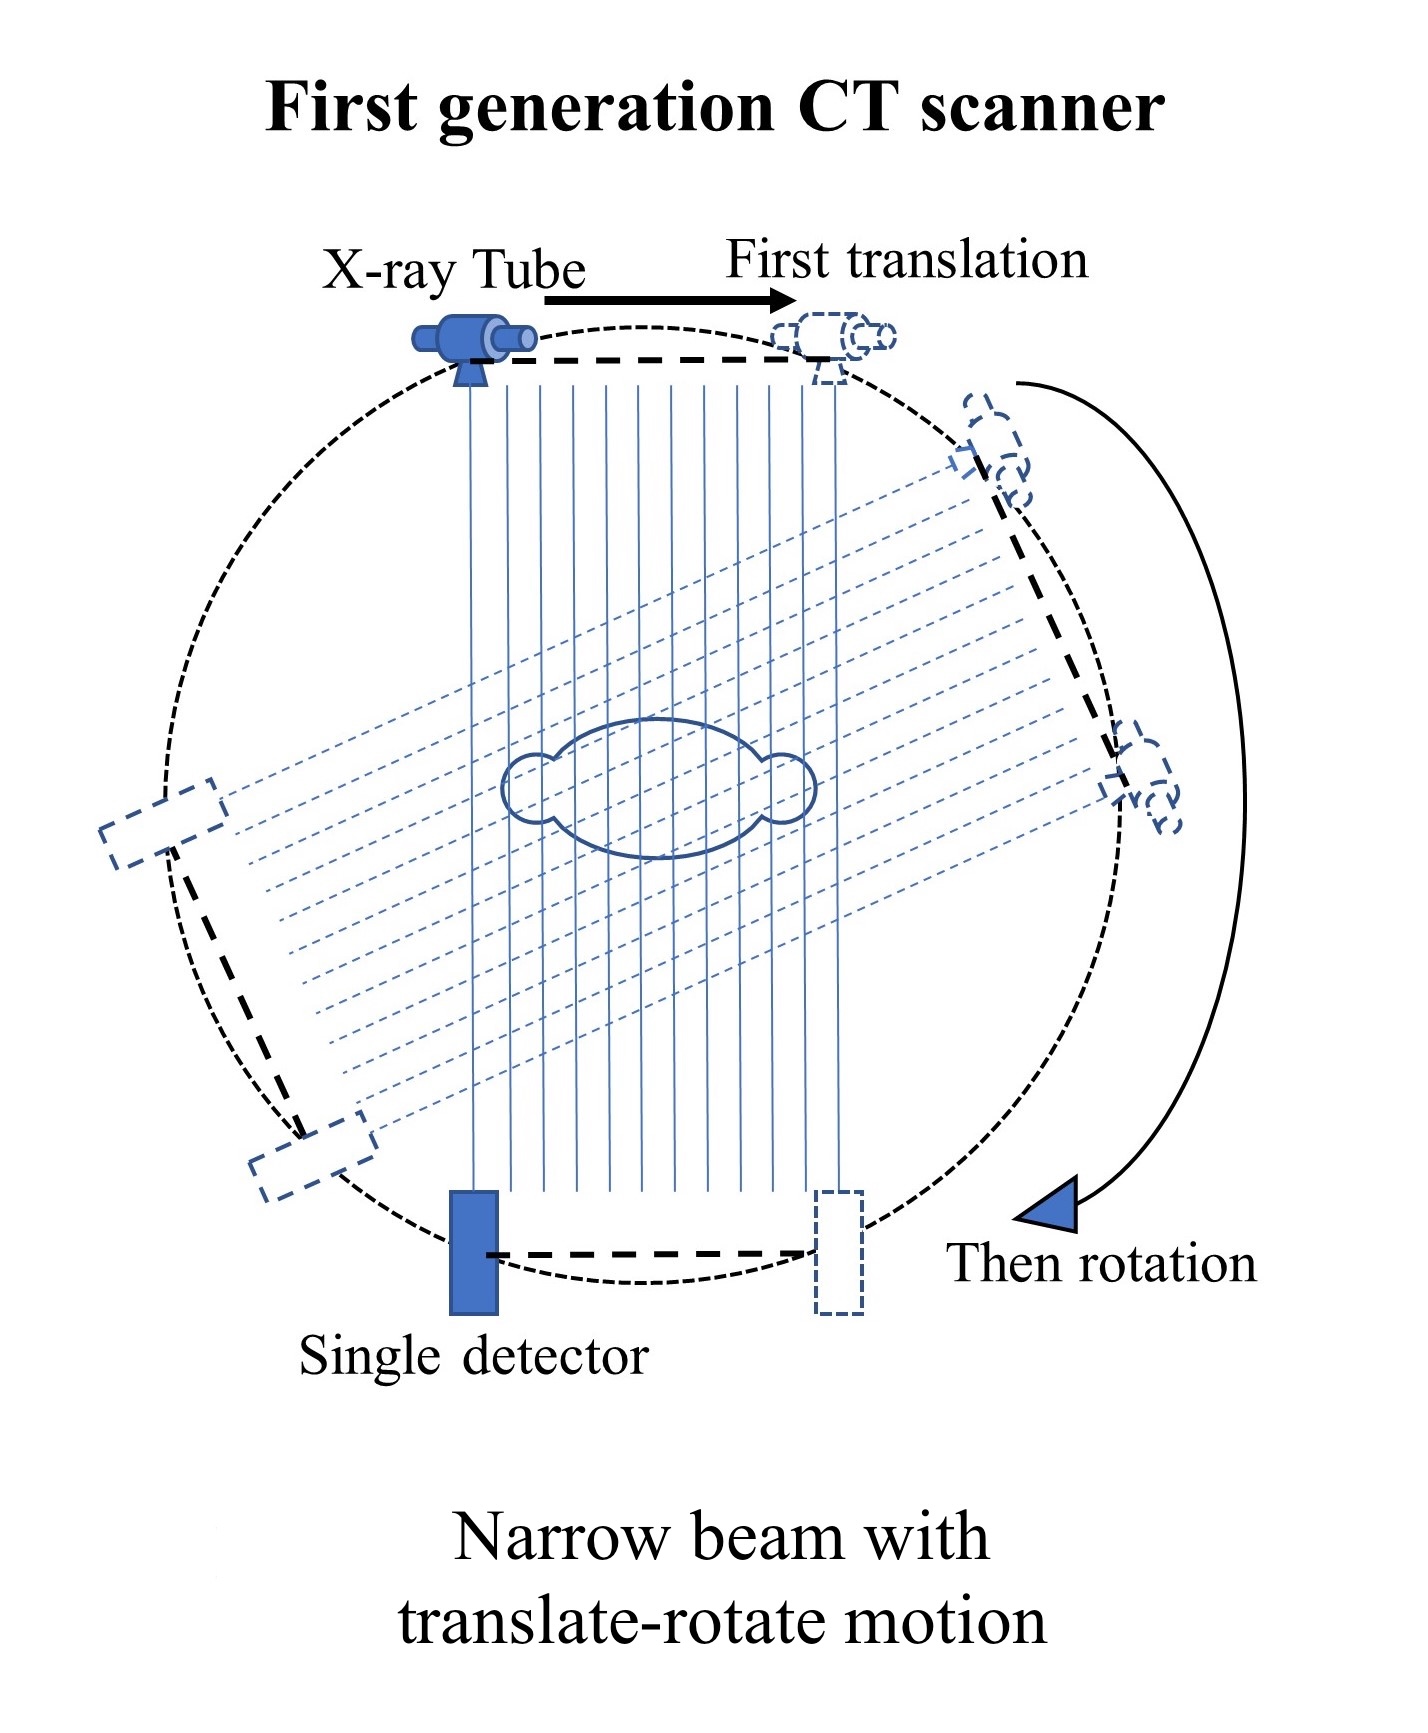
Narrow Beam With Translate-Rotate Motion. First-generation CT scanners used a pencil beam that had a 3 mm width and 13 mm length and took around 5 or 6 minutes to complete the scan.
Contributed by D Prakash, MSc. (Physics, Bioinformatics), DMRIT, RSO (NM)
(Click Image to Enlarge)

Multiple-Narrow Beam With Translate-Rotate Motion. The second-generation CT scanners were introduced with the same translation-rotational motion but with a multi-detector system that formed multiple narrow beams.
Contributed by D Prakash, MSc. (Physics, Bioinformatics), DMRIT, RSO (NM)
(Click Image to Enlarge)
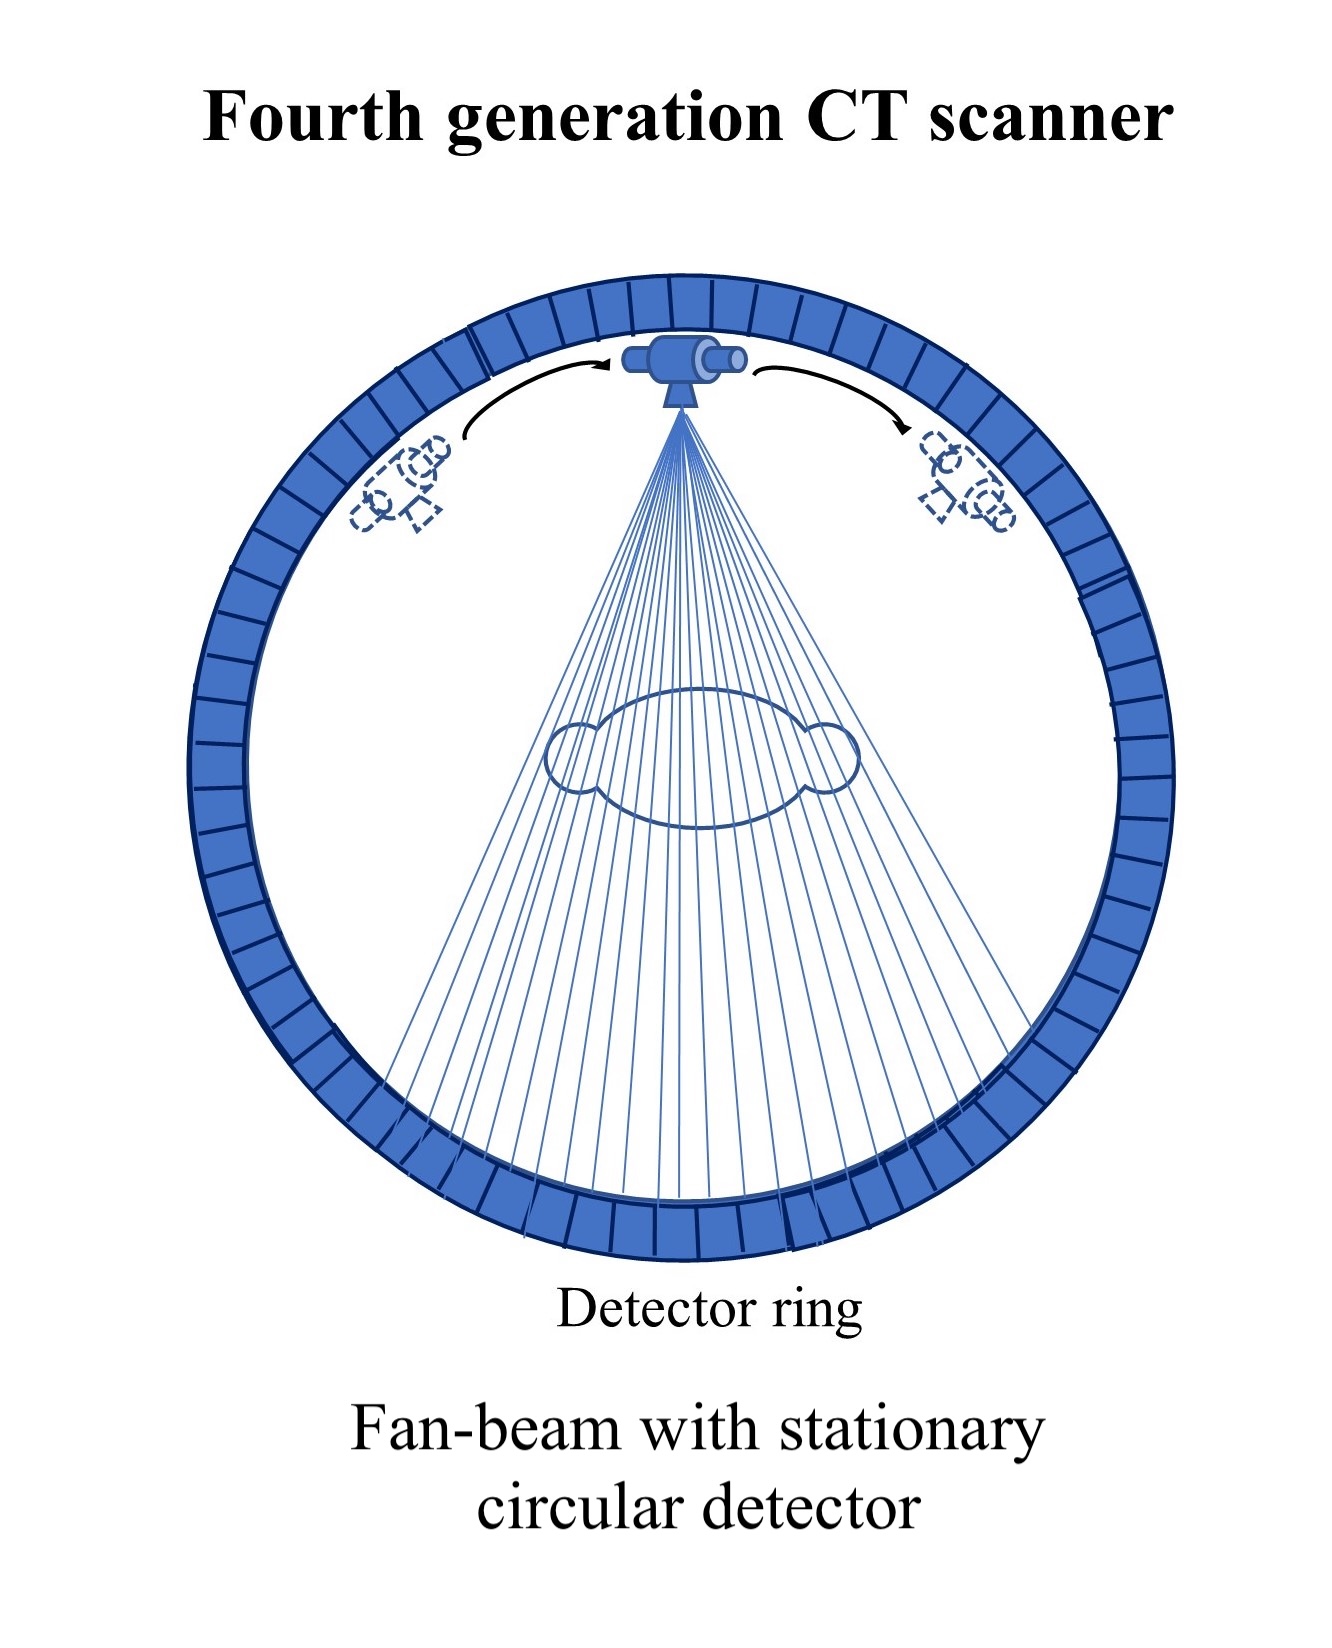
Fan-Beam With Stationary Circular Detector. The fourth generation of CT scanners was introduced in 1976. The detector formed an enclosed stationary ring, and the x-ray tube rotated in a circular motion around the patient inside that ring, achieving a one-second scan duration.
Contributed by D Prakash, MSc. (Physics, Bioinformatics), DMRIT, RSO (NM)
(Click Image to Enlarge)

Fan-Beam, Rotate Only. The third-generation CT scanners eliminated translational motion and performed rotational motion only. The x-ray beam was widened as a fan beam to cover the whole patient in the field of view using an array of detectors, and the acquisition took less than 5 seconds.
Contributed by D Prakash, MSc. (Physics, Bioinformatics), DMRIT, RSO (NM)
(Click Image to Enlarge)
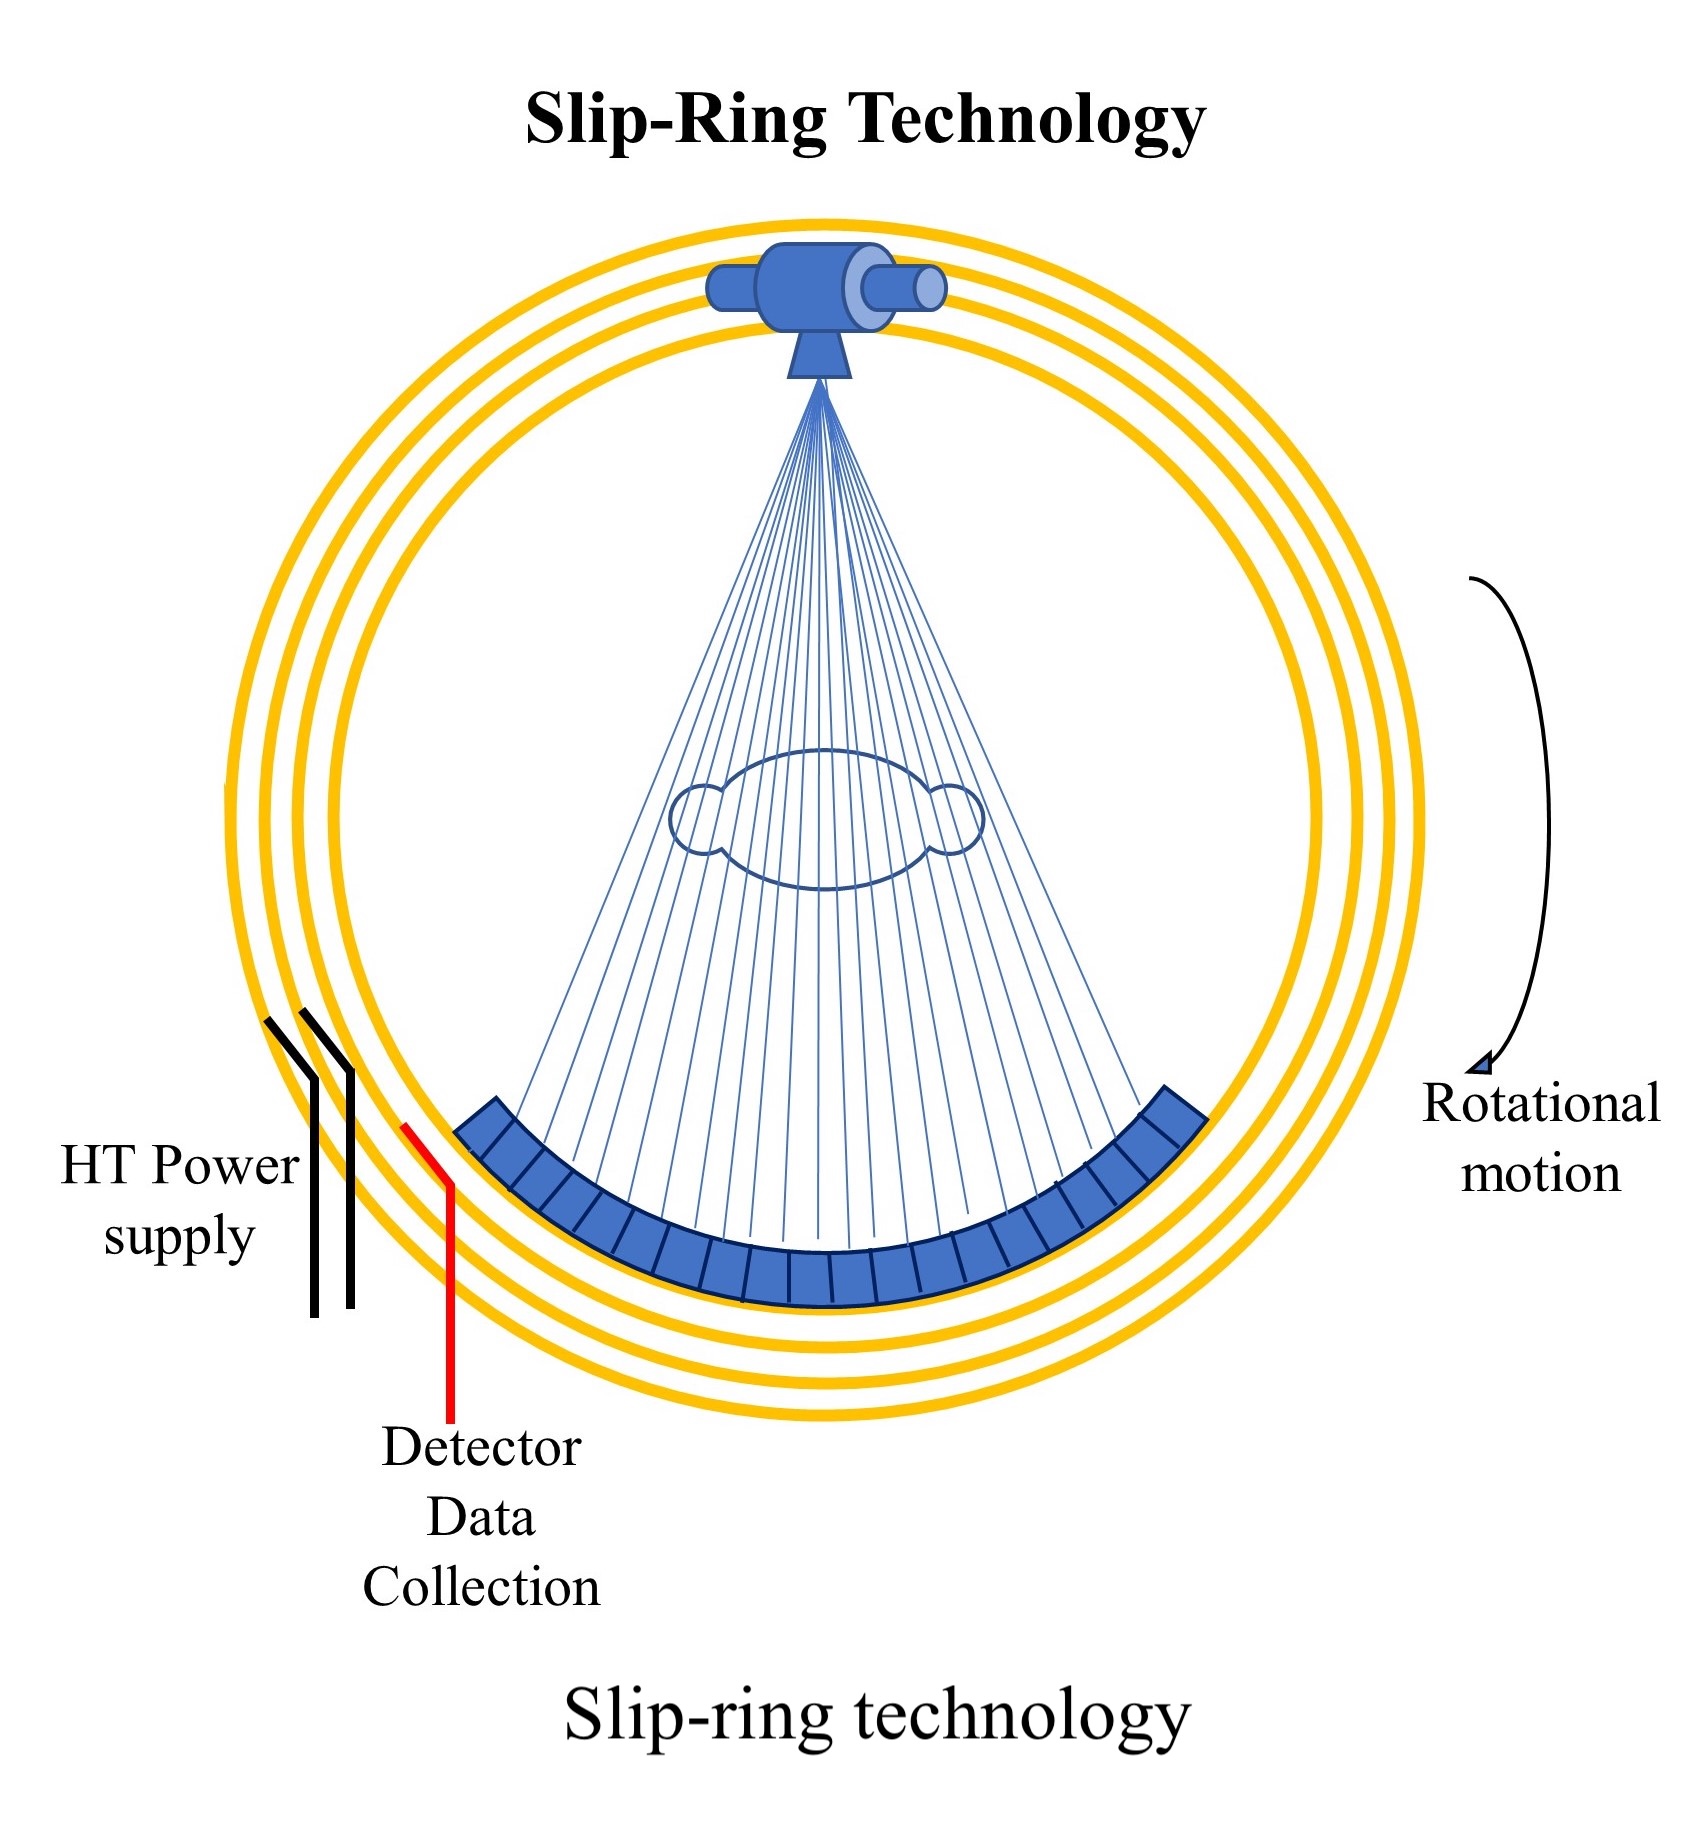
Slip-Ring Technology. The slip ring is a circular ring that transfers power and data signals from the stationary part to the rotating part of the scanner.
Contributed by D Prakash, MSc. (Physics, Bioinformatics), DMRIT, RSO (NM)
(Click Image to Enlarge)
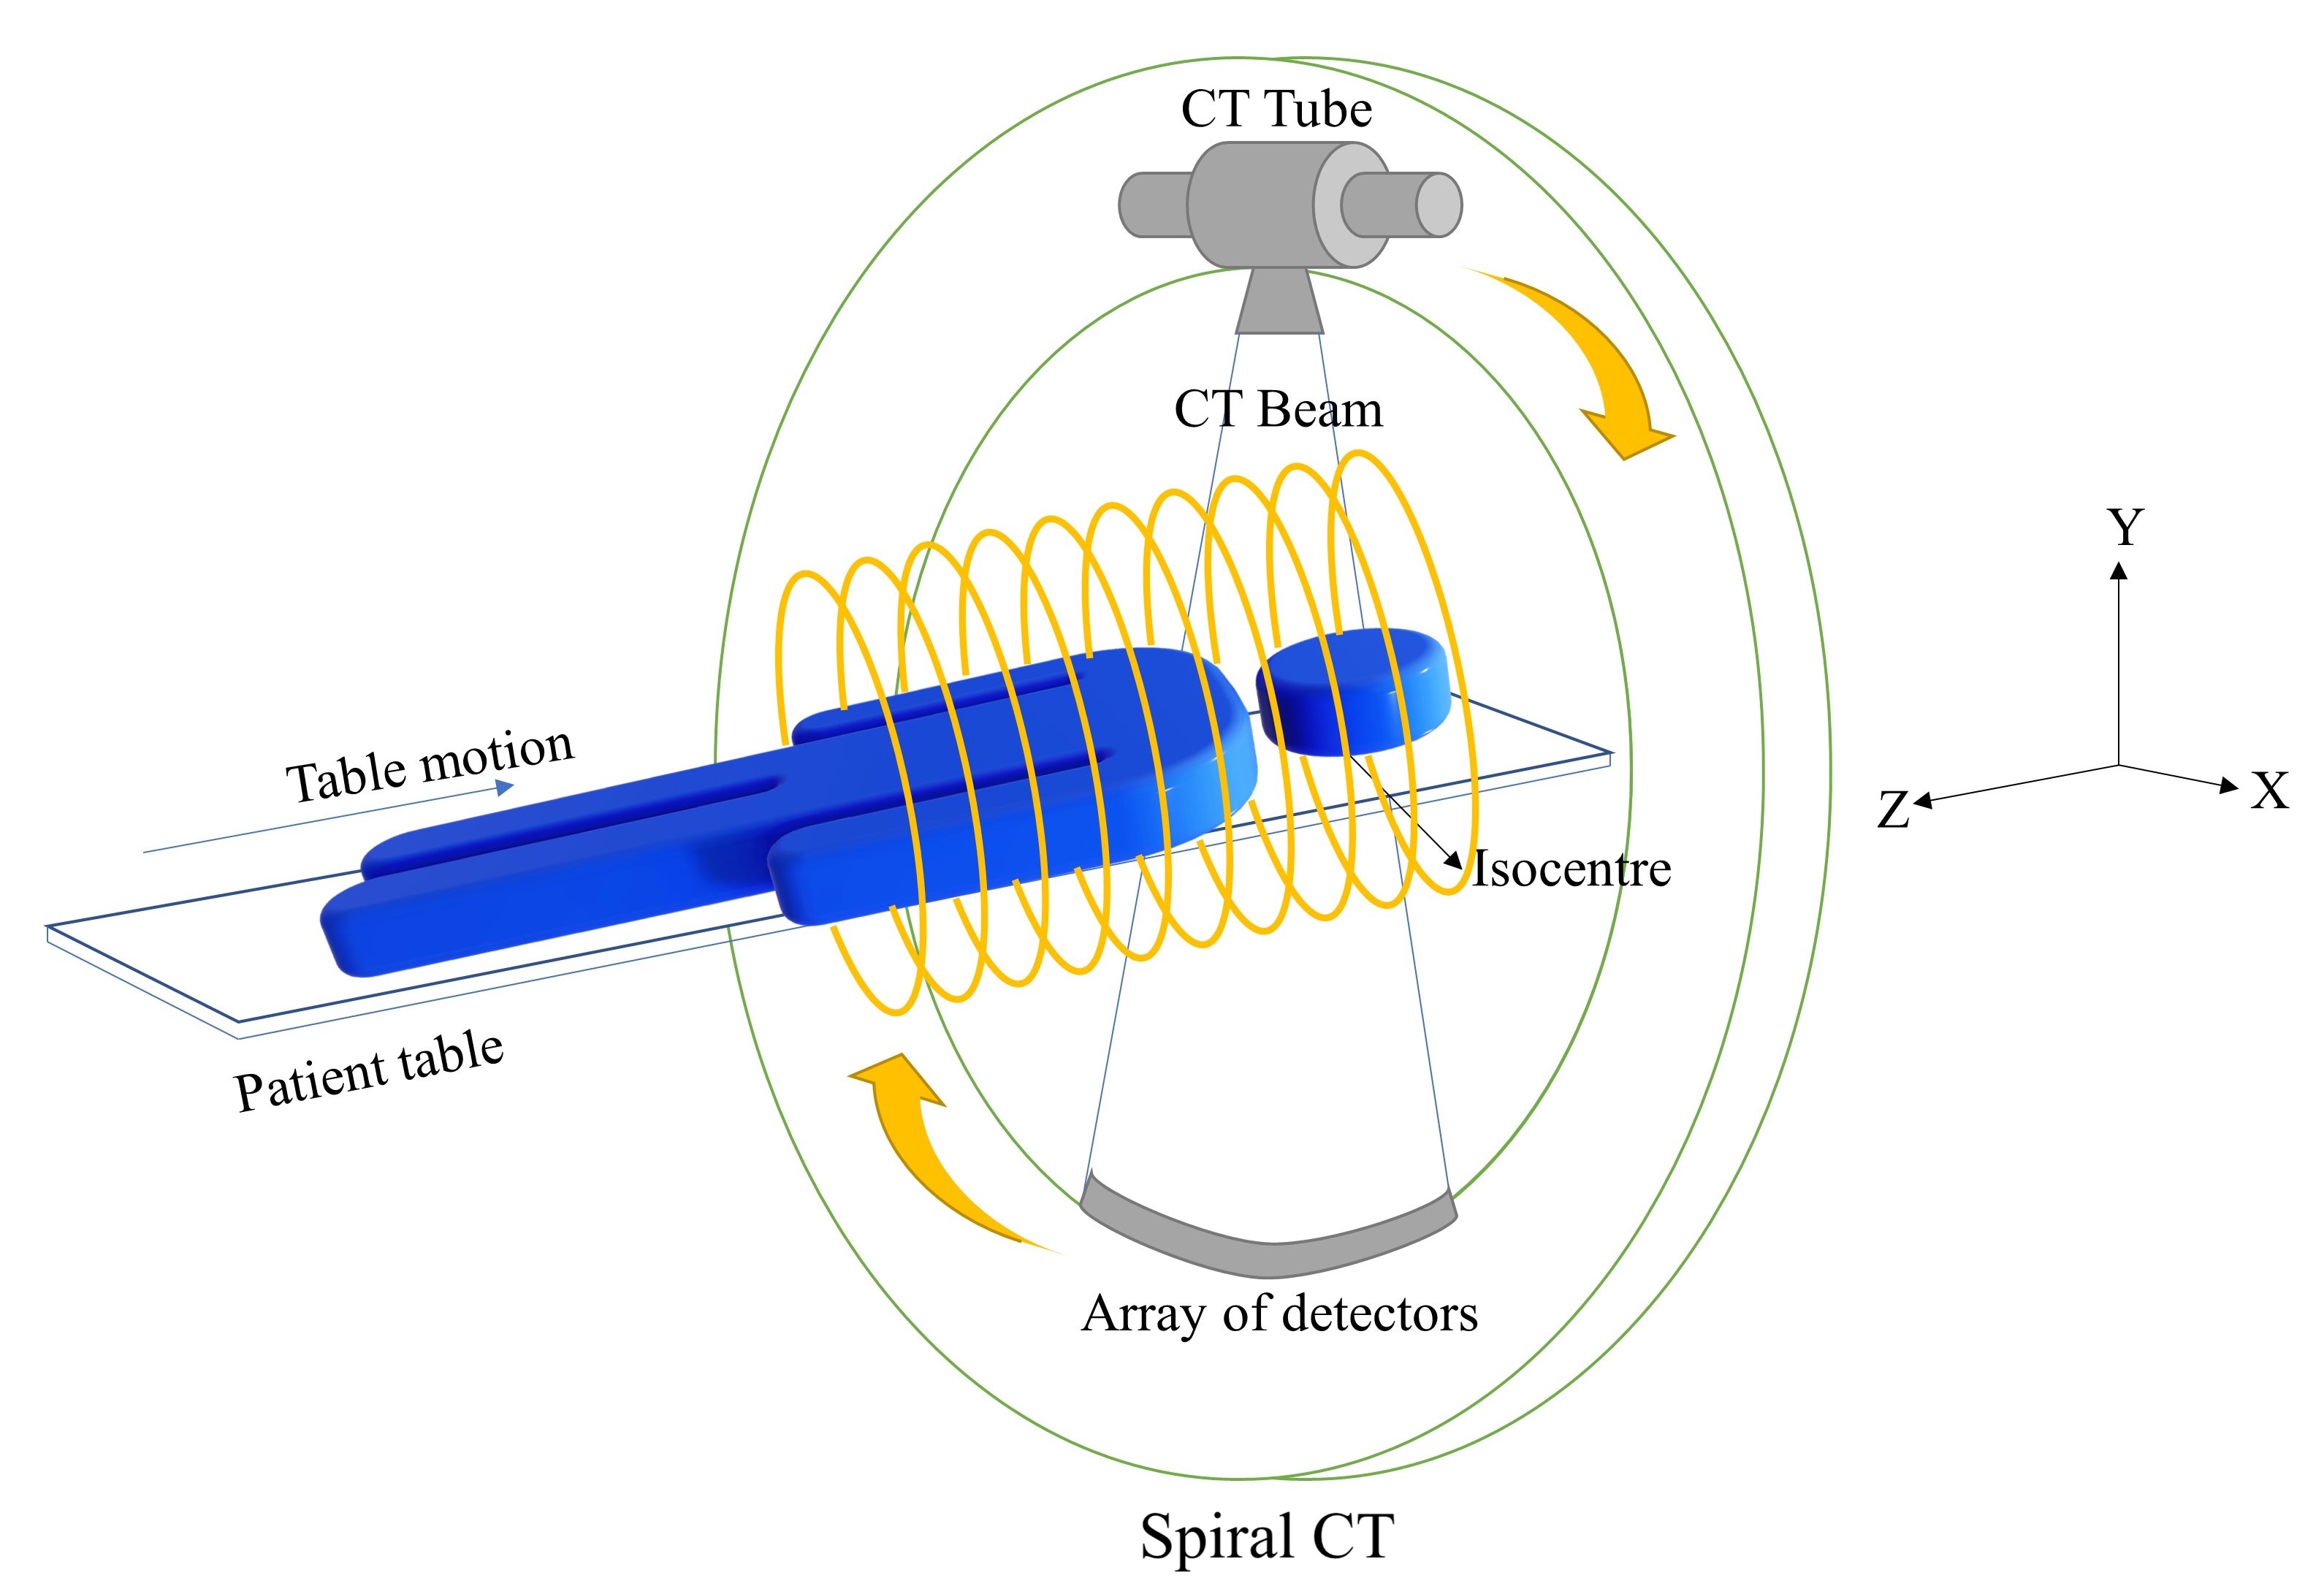
Spiral CT Machines. In spiral CT machines, the x-ray tube and detector assembly move around the object in a circular rotatory motion in the XY plane to acquire the images continuously.
Contributed by D Prakash, MSc. (Physics, Bioinformatics), DMRIT, RSO (NM)
(Click Image to Enlarge)
Multislice CT Scanners. These CT scanners contain a rotating arc of detectors and x-ray tubes, allowing volumetric coverage of data acquisition with thin slices. The detectors are placed along the Z-direction in multiple rows.
Contributed by D Prakash, MSc. (Physics, Bioinformatics), DMRIT, RSO (NM)
(Click Image to Enlarge)
Production of X-rays. The thermionic emission phenomenon improves the release of electrons from filament using electric current and accelerates them towards the anode to produce x-rays. This production method is the prototype for the current generation of x-ray tubes.
Contributed by D Prakash, MSc. (Physics, Bioinformatics), DMRIT, RSO (NM)
References
Wang R, Duan X, Shen C, Han D, Ma J, Wu H, Xu X, Qin T, Fan Q, Zhang Z, Shi W, Guo Y. A retrospective study of SPECT/CT scans using SUV measurement of the normal pelvis with Tc-99m methylene diphosphonate. Journal of X-ray science and technology. 2018:26(6):895-908. doi: 10.3233/XST-180391. Epub [PubMed PMID: 30103368]
Level 2 (mid-level) evidenceKaneta T, Ogawa M, Daisaki H, Nawata S, Yoshida K, Inoue T. SUV measurement of normal vertebrae using SPECT/CT with Tc-99m methylene diphosphonate. American journal of nuclear medicine and molecular imaging. 2016:6(5):262-268 [PubMed PMID: 27766184]
Kinahan PE, Fletcher JW. Positron emission tomography-computed tomography standardized uptake values in clinical practice and assessing response to therapy. Seminars in ultrasound, CT, and MR. 2010 Dec:31(6):496-505. doi: 10.1053/j.sult.2010.10.001. Epub [PubMed PMID: 21147377]
Townsend DW. Positron emission tomography/computed tomography. Seminars in nuclear medicine. 2008 May:38(3):152-66. doi: 10.1053/j.semnuclmed.2008.01.003. Epub [PubMed PMID: 18396176]
Townsend DW. Dual-modality imaging: combining anatomy and function. Journal of nuclear medicine : official publication, Society of Nuclear Medicine. 2008 Jun:49(6):938-55. doi: 10.2967/jnumed.108.051276. Epub 2008 May 15 [PubMed PMID: 18483101]
Bocher M, Balan A, Krausz Y, Shrem Y, Lonn A, Wilk M, Chisin R. Gamma camera-mounted anatomical X-ray tomography: technology, system characteristics and first images. European journal of nuclear medicine. 2000 Jun:27(6):619-27 [PubMed PMID: 10901447]
Level 3 (low-level) evidencePatton JA, Delbeke D, Sandler MP. Image fusion using an integrated, dual-head coincidence camera with X-ray tube-based attenuation maps. Journal of nuclear medicine : official publication, Society of Nuclear Medicine. 2000 Aug:41(8):1364-8 [PubMed PMID: 10945529]
Townsend DW, Beyer T, Blodgett TM. PET/CT scanners: a hardware approach to image fusion. Seminars in nuclear medicine. 2003 Jul:33(3):193-204 [PubMed PMID: 12931321]
Townsend DW, Carney JP, Yap JT, Hall NC. PET/CT today and tomorrow. Journal of nuclear medicine : official publication, Society of Nuclear Medicine. 2004 Jan:45 Suppl 1():4S-14S [PubMed PMID: 14736831]
Ljungberg M, Pretorius PH. SPECT/CT: an update on technological developments and clinical applications. The British journal of radiology. 2018 Jan:91(1081):20160402. doi: 10.1259/bjr.20160402. Epub 2017 Jan 16 [PubMed PMID: 27845567]
Bailey DL, Willowson KP. An evidence-based review of quantitative SPECT imaging and potential clinical applications. Journal of nuclear medicine : official publication, Society of Nuclear Medicine. 2013 Jan:54(1):83-9. doi: 10.2967/jnumed.112.111476. Epub [PubMed PMID: 23283563]
Samim A, Tytgat GAM, Bleeker G, Wenker STM, Chatalic KLS, Poot AJ, Tolboom N, van Noesel MM, Lam MGEH, de Keizer B. Nuclear Medicine Imaging in Neuroblastoma: Current Status and New Developments. Journal of personalized medicine. 2021 Apr 4:11(4):. doi: 10.3390/jpm11040270. Epub 2021 Apr 4 [PubMed PMID: 33916640]
Darami M, Mahmoudian B, Ljungberg M, Pirayesh Islamian J. Impact of Wolfmet Tungsten Alloys as Parallel-Hole Collimator Material on Single-Photon Emission Computed Tomography Image Quality and Functional Parameters: A Simulating Medical Imaging Nuclear Detectors Monte Carlo Study. World journal of nuclear medicine. 2023 Sep:22(3):217-225. doi: 10.1055/s-0043-1771287. Epub 2023 Sep 6 [PubMed PMID: 37854088]
Level 2 (mid-level) evidenceLiu WP, Huan D, Wang JG, Lv QL, Ibrahim U, Jin XX, Tao ZY. Esophageal Scab Mimicking a Parasite: A Case Report. The American journal of case reports. 2020 Jun 27:21():e925199. doi: 10.12659/AJCR.925199. Epub 2020 Jun 27 [PubMed PMID: 32591495]
Level 3 (low-level) evidenceBroens B, van der Laken CJ, Zwezerijnen GJC, Nossent EJ, Meijboom LJ, Spierings J, de Vries-Bouwstra JK, van Laar JM, Voskuyl AE. Positron Emission Tomography to Improve Assessment of Interstitial Lung Disease in Patients With Systemic Sclerosis Eligible for Autologous Stem Cell Transplantation. Frontiers in immunology. 2022:13():923869. doi: 10.3389/fimmu.2022.923869. Epub 2022 Jul 5 [PubMed PMID: 35865521]
Bercovich E, Javitt MC. Medical Imaging: From Roentgen to the Digital Revolution, and Beyond. Rambam Maimonides medical journal. 2018 Oct 4:9(4):. doi: 10.5041/RMMJ.10355. Epub 2018 Oct 4 [PubMed PMID: 30309440]
Wesolowski JR, Lev MH. CT: history, technology, and clinical aspects. Seminars in ultrasound, CT, and MR. 2005 Dec:26(6):376-9 [PubMed PMID: 16392657]
Flohr TG, Schaller S, Stierstorfer K, Bruder H, Ohnesorge BM, Schoepf UJ. Multi-detector row CT systems and image-reconstruction techniques. Radiology. 2005 Jun:235(3):756-73 [PubMed PMID: 15833981]
Commandeur F, Goeller M, Dey D. Cardiac CT: Technological Advances in Hardware, Software, and Machine Learning Applications. Current cardiovascular imaging reports. 2018 Aug:11():. pii: 19. doi: 10.1007/s12410-018-9459-z. Epub 2018 Jun 29 [PubMed PMID: 31656551]
Level 3 (low-level) evidenceGoldman LW. Principles of CT and CT technology. Journal of nuclear medicine technology. 2007 Sep:35(3):115-28; quiz 129-30 [PubMed PMID: 17823453]
Kalender WA. Technical foundations of spiral CT. Seminars in ultrasound, CT, and MR. 1994 Apr:15(2):81-9 [PubMed PMID: 8198822]
Goldman LW. Principles of CT: multislice CT. Journal of nuclear medicine technology. 2008 Jun:36(2):57-68; quiz 75-6. doi: 10.2967/jnmt.107.044826. Epub 2008 May 15 [PubMed PMID: 18483143]
Hurlock GS, Higashino H, Mochizuki T. History of cardiac computed tomography: single to 320-detector row multislice computed tomography. The international journal of cardiovascular imaging. 2009 Apr:25 Suppl 1():31-42. doi: 10.1007/s10554-008-9408-z. Epub 2009 Jan 15 [PubMed PMID: 19145476]
Tan Z, Miao Q, Li X, Ren K, Zhao Y, Zhao L, Li X, Liu Y, Chai R, Xu K. The primary study of low-dose pancreas perfusion by 640- slice helical CT: a whole-organ perfusion. SpringerPlus. 2015:4():192. doi: 10.1186/s40064-015-0950-6. Epub 2015 Apr 21 [PubMed PMID: 25932375]
Behling R. X-ray sources: 125 years of developments of this intriguing technology. Physica medica : PM : an international journal devoted to the applications of physics to medicine and biology : official journal of the Italian Association of Biomedical Physics (AIFB). 2020 Nov:79():162-187. doi: 10.1016/j.ejmp.2020.07.021. Epub 2020 Aug 19 [PubMed PMID: 32826172]
Jain A, Panse A, Bednarek DR, Rudin S. Focal spot measurements using a digital flat panel detector. Proceedings of SPIE--the International Society for Optical Engineering. 2014 Mar 19:9033(90335F):. doi: 10.1117/12.2043057. Epub [PubMed PMID: 25302004]
Hutton BF. The origins of SPECT and SPECT/CT. European journal of nuclear medicine and molecular imaging. 2014 May:41 Suppl 1():S3-16. doi: 10.1007/s00259-013-2606-5. Epub 2013 Nov 12 [PubMed PMID: 24218098]
Townsend DW, Beyer T. A combined PET/CT scanner: the path to true image fusion. The British journal of radiology. 2002 Nov:75 Spec No():S24-30 [PubMed PMID: 12519732]
Level 3 (low-level) evidenceIchihara T, Ogawa K, Motomura N, Kubo A, Hashimoto S. Compton scatter compensation using the triple-energy window method for single- and dual-isotope SPECT. Journal of nuclear medicine : official publication, Society of Nuclear Medicine. 1993 Dec:34(12):2216-21 [PubMed PMID: 8254414]
Meikle SR, Hutton BF, Bailey DL. A transmission-dependent method for scatter correction in SPECT. Journal of nuclear medicine : official publication, Society of Nuclear Medicine. 1994 Feb:35(2):360-7 [PubMed PMID: 8295011]
Level 3 (low-level) evidenceBeekman FJ, Kamphuis C, Frey EC. Scatter compensation methods in 3D iterative SPECT reconstruction: a simulation study. Physics in medicine and biology. 1997 Aug:42(8):1619-32 [PubMed PMID: 9279910]
Kadrmas DJ, Frey EC, Karimi SS, Tsui BM. Fast implementations of reconstruction-based scatter compensation in fully 3D SPECT image reconstruction. Physics in medicine and biology. 1998 Apr:43(4):857-73 [PubMed PMID: 9572510]
Conti M, Eriksson L. Physics of pure and non-pure positron emitters for PET: a review and a discussion. EJNMMI physics. 2016 Dec:3(1):8. doi: 10.1186/s40658-016-0144-5. Epub 2016 May 23 [PubMed PMID: 27271304]
Vandenberghe S, Moskal P, Karp JS. State of the art in total body PET. EJNMMI physics. 2020 May 25:7(1):35. doi: 10.1186/s40658-020-00290-2. Epub 2020 May 25 [PubMed PMID: 32451783]
Hicks R, Lau E, Binns D. Hybrid imaging is the future of molecular imaging. Biomedical imaging and intervention journal. 2007 Jul:3(3):e49. doi: 10.2349/biij.3.3.e49. Epub 2007 Jul 1 [PubMed PMID: 21614291]
Blodgett TM, Mehta AS, Mehta AS, Laymon CM, Carney J, Townsend DW. PET/CT artifacts. Clinical imaging. 2011 Jan-Feb:35(1):49-63. doi: 10.1016/j.clinimag.2010.03.001. Epub [PubMed PMID: 21237418]
Bujenovic S, Mannting F, Chakrabarti R, Ladnier D. Artifactual 2-deoxy-2-[(18)F]fluoro-D-glucose localization surrounding metallic objects in a PET/CT scanner using CT-based attenuation correction. Molecular imaging and biology. 2003 Jan-Feb:5(1):20-2 [PubMed PMID: 14499157]
Level 3 (low-level) evidenceGoerres GW, Hany TF, Kamel E, von Schulthess GK, Buck A. Head and neck imaging with PET and PET/CT: artefacts from dental metallic implants. European journal of nuclear medicine and molecular imaging. 2002 Mar:29(3):367-70 [PubMed PMID: 12002712]
Kamel EM, Burger C, Buck A, von Schulthess GK, Goerres GW. Impact of metallic dental implants on CT-based attenuation correction in a combined PET/CT scanner. European radiology. 2003 Apr:13(4):724-8 [PubMed PMID: 12664109]
Komek H, Yilmaz EE, Cakabay B, Altindag S, Ozdemir N, Can C, Kepenek F. Contrast Enhanced [99mTc] MIBI SPECT/CT in Primary Hyperparathyroidism. Annali italiani di chirurgia. 2018:89():379-384 [PubMed PMID: 30049907]
Horger M, Eschmann SM, Pfannenberg C, Storek D, Dammann F, Vonthein R, Claussen CD, Bares R. The value of SPET/CT in chronic osteomyelitis. European journal of nuclear medicine and molecular imaging. 2003 Dec:30(12):1665-73 [PubMed PMID: 14523585]
Filippi L, Schillaci O. Usefulness of hybrid SPECT/CT in 99mTc-HMPAO-labeled leukocyte scintigraphy for bone and joint infections. Journal of nuclear medicine : official publication, Society of Nuclear Medicine. 2006 Dec:47(12):1908-13 [PubMed PMID: 17138732]
Gaemperli O, Kaufmann PA, Alkadhi H. Cardiac hybrid imaging. European journal of nuclear medicine and molecular imaging. 2014 May:41 Suppl 1():S91-103 [PubMed PMID: 24658682]
Gutte H, Mortensen J, Jensen CV, Johnbeck CB, von der Recke P, Petersen CL, Kjaergaard J, Kristoffersen US, Kjaer A. Detection of pulmonary embolism with combined ventilation-perfusion SPECT and low-dose CT: head-to-head comparison with multidetector CT angiography. Journal of nuclear medicine : official publication, Society of Nuclear Medicine. 2009 Dec:50(12):1987-92. doi: 10.2967/jnumed.108.061606. Epub 2009 Nov 12 [PubMed PMID: 19910421]
Lopci E, Fanti S. Non-FDG PET/CT. Recent results in cancer research. Fortschritte der Krebsforschung. Progres dans les recherches sur le cancer. 2020:216():669-718. doi: 10.1007/978-3-030-42618-7_20. Epub [PubMed PMID: 32594402]
Kratochwil C, Flechsig P, Lindner T, Abderrahim L, Altmann A, Mier W, Adeberg S, Rathke H, Röhrich M, Winter H, Plinkert PK, Marme F, Lang M, Kauczor HU, Jäger D, Debus J, Haberkorn U, Giesel FL. (68)Ga-FAPI PET/CT: Tracer Uptake in 28 Different Kinds of Cancer. Journal of nuclear medicine : official publication, Society of Nuclear Medicine. 2019 Jun:60(6):801-805. doi: 10.2967/jnumed.119.227967. Epub 2019 Apr 6 [PubMed PMID: 30954939]
Jiménez-Bonilla JF, Banzo I. Non-oncological applications of PET/CT. Medicina clinica. 2018 May 23:150(10):387-389. doi: 10.1016/j.medcli.2017.10.026. Epub 2017 Nov 28 [PubMed PMID: 29196040]
Park SY, Lee SK, Lim M, Kim B, Hwang BO, Cho ES, Zhang X, Chun KS, Chung WY, Song NY. Direct Contact with Platelets Induces Podoplanin Expression and Invasion in Human Oral Squamous Cell Carcinoma Cells. Biomolecules & therapeutics. 2022 May 1:30(3):284-290. doi: 10.4062/biomolther.2021.167. Epub [PubMed PMID: 35110423]
Bolam SM, O'Regan-Brown A, Paul Monk A, Musson DS, Cornish J, Munro JT. Toxicity of tranexamic acid (TXA) to intra-articular tissue in orthopaedic surgery: a scoping review. Knee surgery, sports traumatology, arthroscopy : official journal of the ESSKA. 2021 Jun:29(6):1862-1871. doi: 10.1007/s00167-020-06219-7. Epub 2020 Aug 29 [PubMed PMID: 32860523]
Level 2 (mid-level) evidenceXu Y, Xia XJ, Zhi HL, Liu ZH. Successful Treatment of Diffuse Pustular Inflammatory Tinea Capitis in the Elderly with Repeated Debridement, Oral Terbinafine and Short-Course Steroids. Mycopathologia. 2023 Oct:188(5):593-595. doi: 10.1007/s11046-023-00719-z. Epub 2023 Apr 25 [PubMed PMID: 37097435]
Runciman W, Hibbert P, Thomson R, Van Der Schaaf T, Sherman H, Lewalle P. Towards an International Classification for Patient Safety: key concepts and terms. International journal for quality in health care : journal of the International Society for Quality in Health Care. 2009 Feb:21(1):18-26. doi: 10.1093/intqhc/mzn057. Epub [PubMed PMID: 19147597]
Level 2 (mid-level) evidenceKasalak Ö, Yakar D, Dierckx RAJO, Kwee TC. Patient safety in nuclear medicine: identification of key strategic areas for vigilance and improvement. Nuclear medicine communications. 2020 Nov:41(11):1111-1116. doi: 10.1097/MNM.0000000000001262. Epub [PubMed PMID: 32769813]
Schreiber M, Klingelhöfer D, Groneberg DA, Brüggmann D. Patient safety: the landscape of the global research output and gender distribution. BMJ open. 2016 Feb 12:6(2):e008322. doi: 10.1136/bmjopen-2015-008322. Epub 2016 Feb 12 [PubMed PMID: 26873042]
Institute of Medicine (US) Committee on Quality of Health Care in America, Kohn LT, Corrigan JM, Donaldson MS. To Err is Human: Building a Safer Health System. 2000:(): [PubMed PMID: 25077248]
Level 2 (mid-level) evidence